


Have you ever needed to build, say, a pyramid diagram or a pyramid graph using only your browser? If so, this collection of online resources is for you.
* * *

ChartMaker is a nice tool to draw line, bar, and pie charts, Venn diagrams, and scatter plots. Afterwards, you will save or share your chart with ease.
* * *
ChartGo


This builder makes line, bar, pie, and area diagrams. Customize colors, dimensions, fonts, enter your data, and hit "create". Chartgo simplifies the process like a pro.
* * *
ONLINECHARTTOOL

You will create a pyramid diagram, bar graphs or pie charts, area, meter, line graphs, etc. Just choose the colors, fonts, switch between 2D and 3D and you're ready to draw your pyramid.
* * *
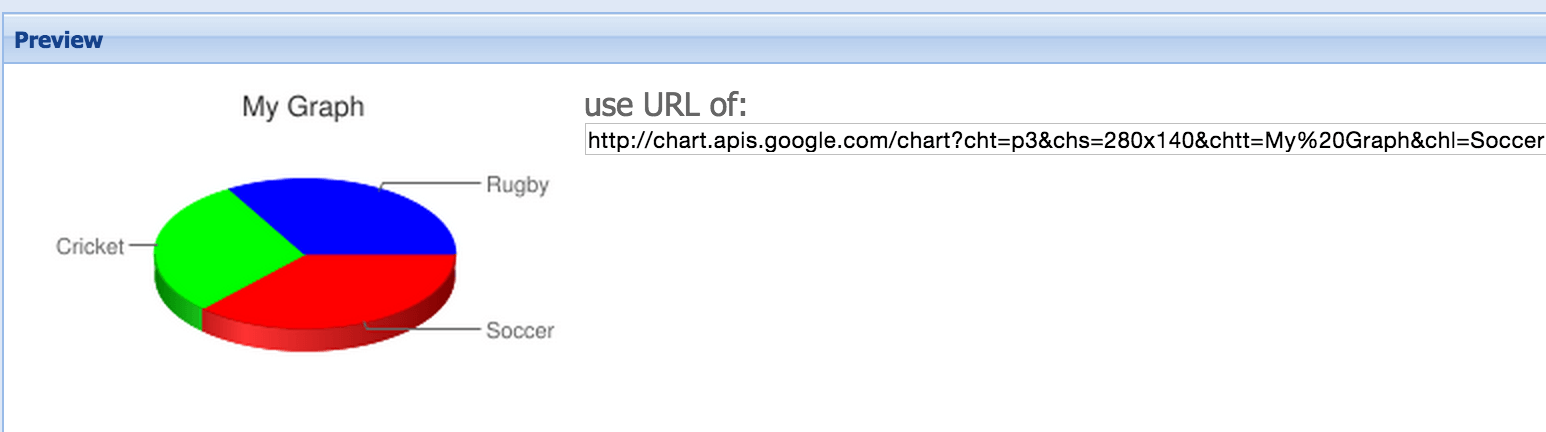
GoogleChartGenerator

This constructor by Jon Winstanley uses Google API and produces visual figures good for any presentation. Just speify the area, type, and design of your diagrams, set axis tick, and enter your data.
* * *
LineGraphMaker
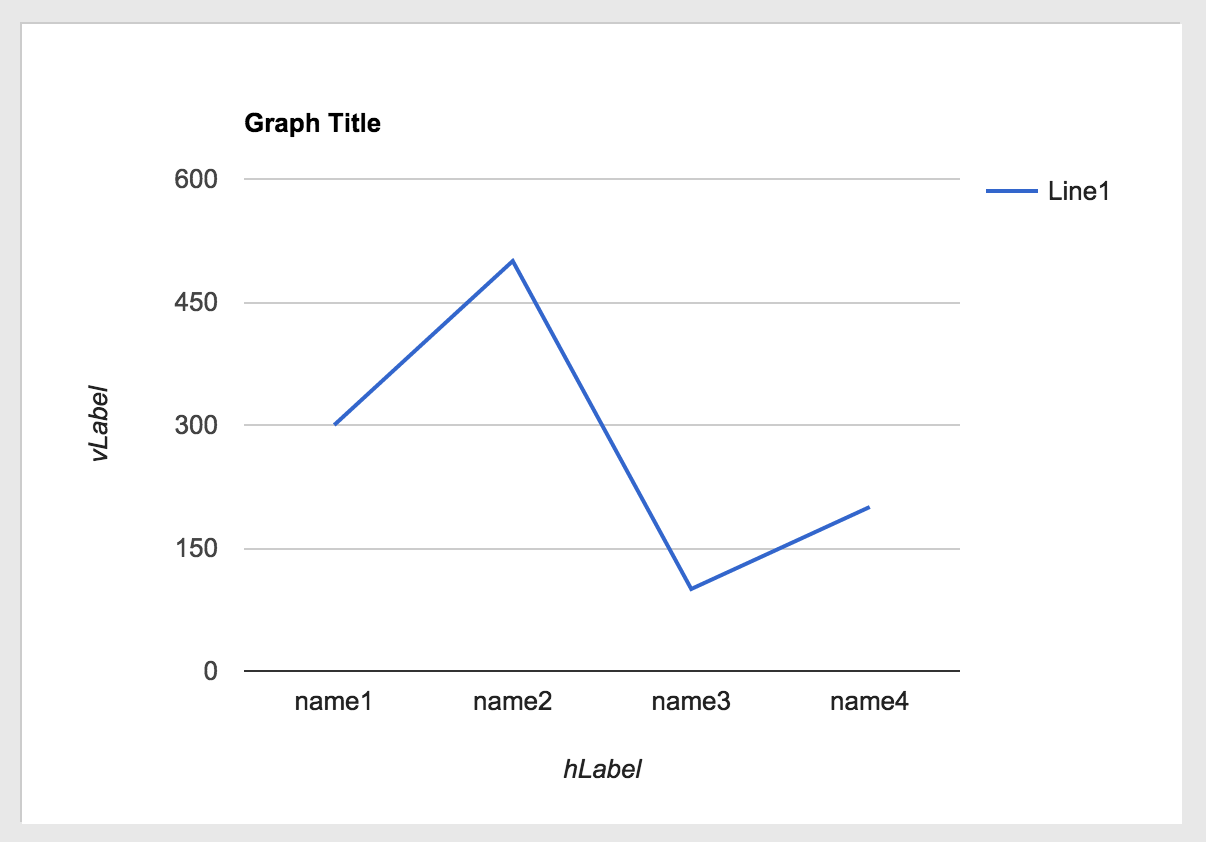

A line graph may be used for displaying trends and flactuations. Switch the constructor to make a bar or pie chart.
* * *
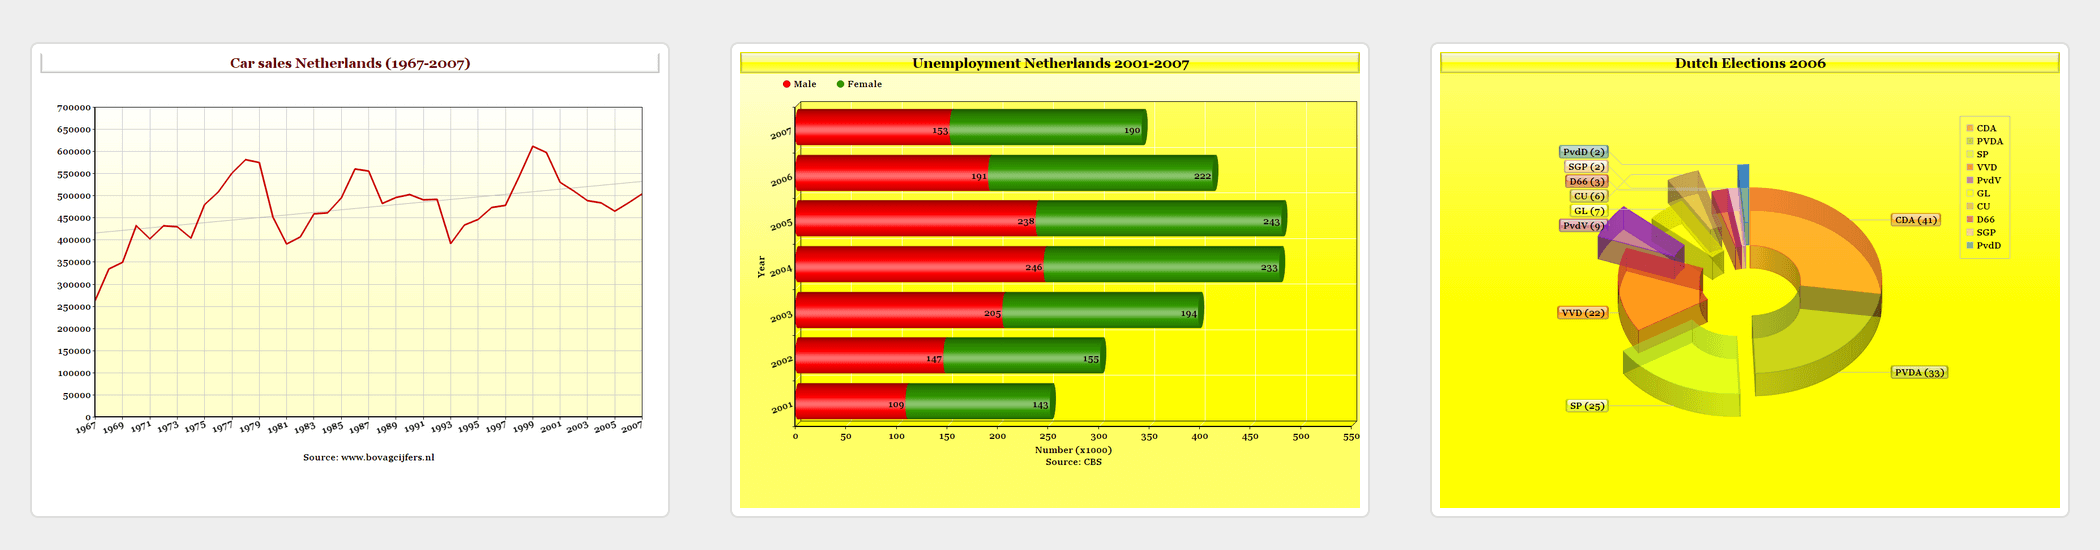
amCharts
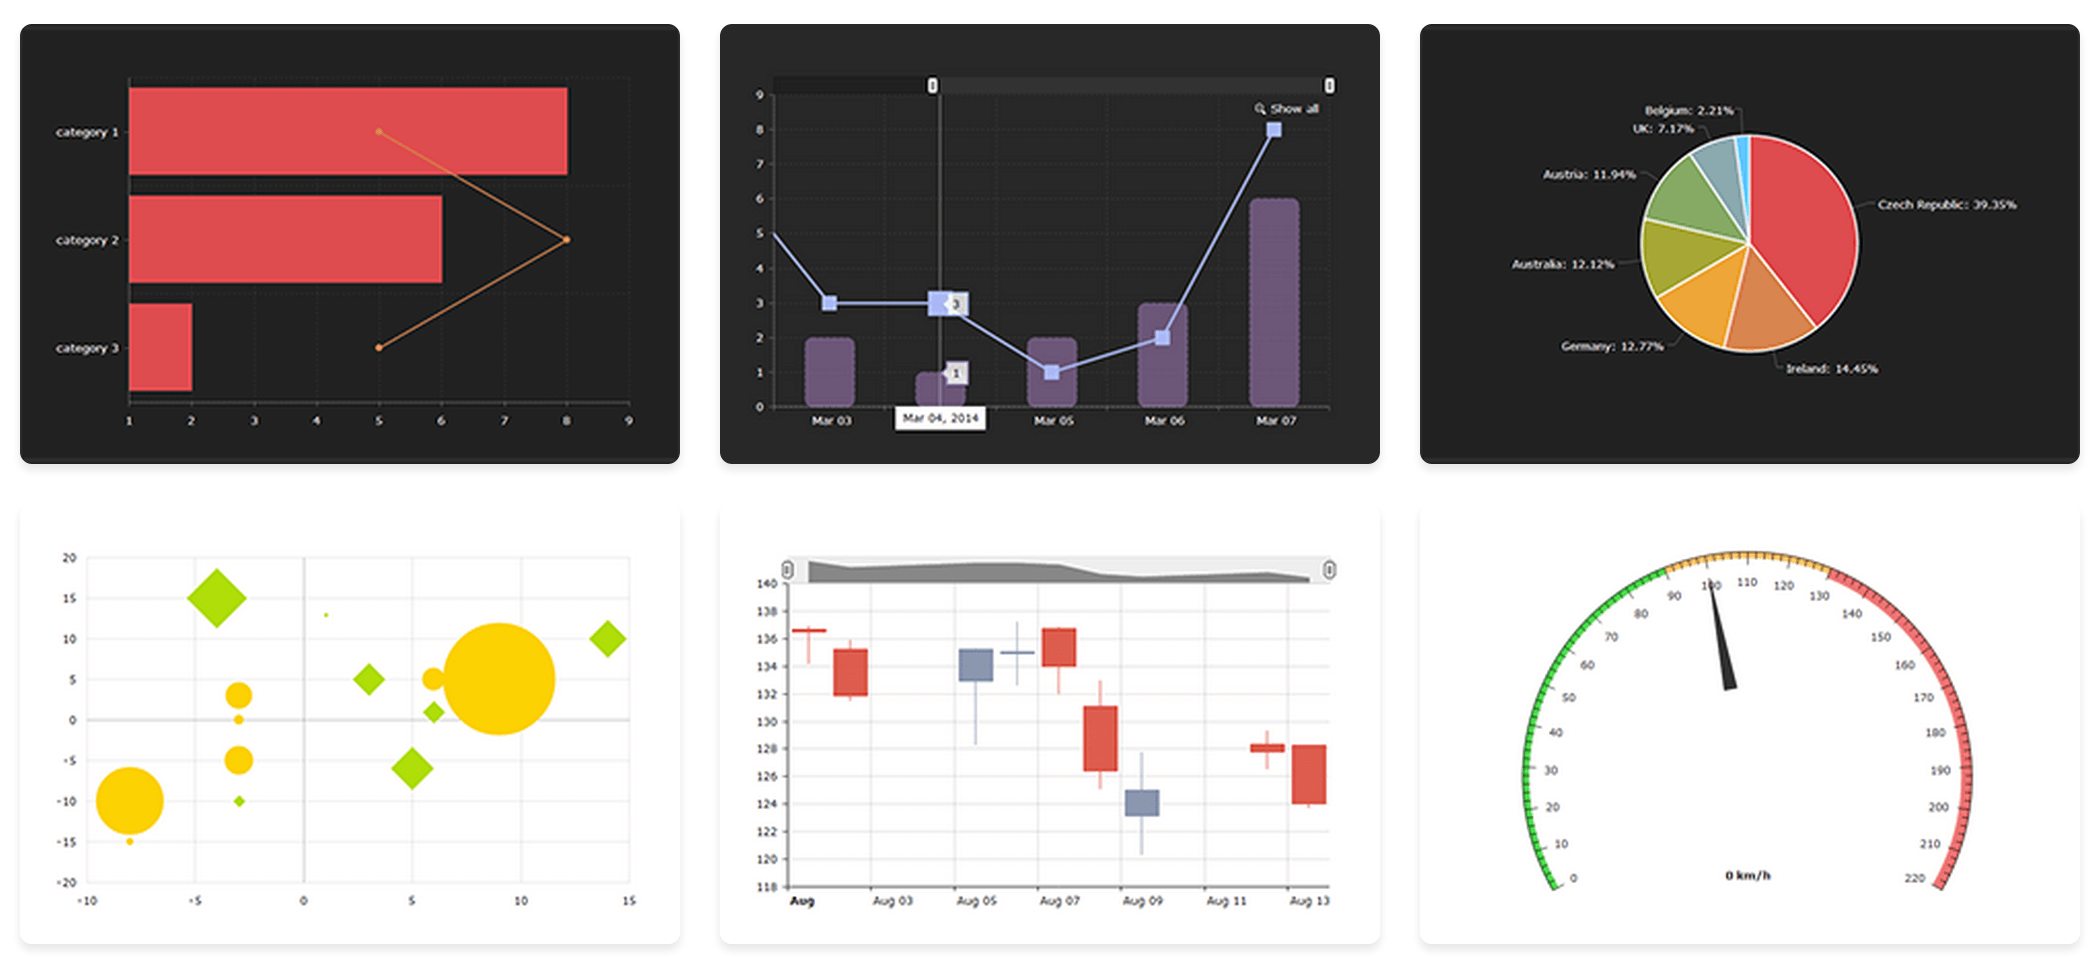

amCharts focuses on building modern charts and graphs for conferences and product presentations. You are invited to create a chart with 9 chart templates. Remember is that amCharts uses a custom built software, you will have to use a certian HTML code to add interactive features to your graph or chart.
* * *
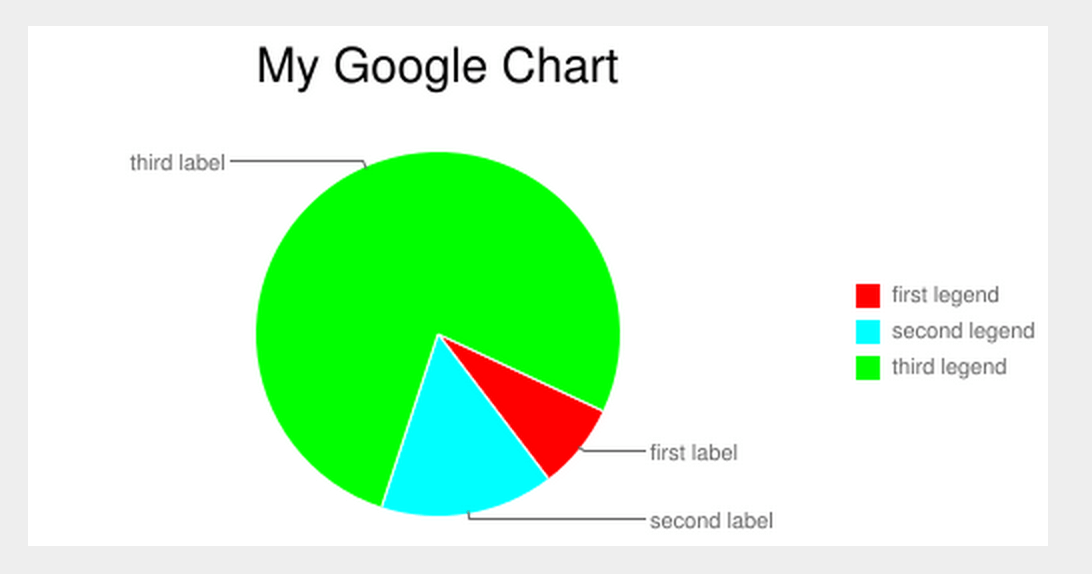
GoogleCharts
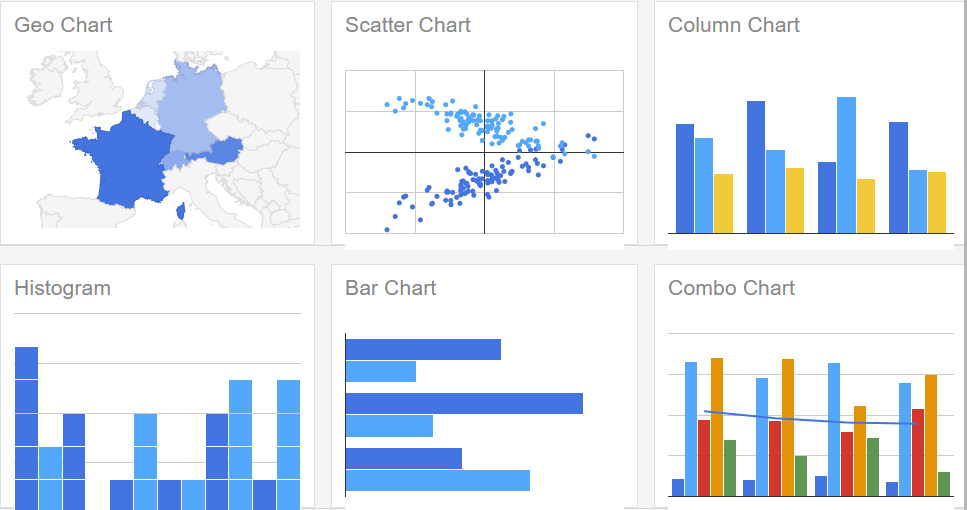
GoogleCharts is the most popular online chart software that offers 20+ options to build flat or interactive figures (including area, pie, doughnut charts, and many more). These are pannable, zoomable, and based on pure HTML5/SVG technology, so no plugins are required.