Understanding Online Store Performance. Basic Key Metrics
In today's post we are going to look closely at the key metrics of Web Analytics, what they are and what they measure. Key metrics are like physical parameters of your body: temperature, blood pressure, etc. If something is wrong with them, your state of health worsens...the same is with key metrics, if some indications worsen you shop's overall condition may regress.
Getting Started with Google Analytics: Free Ebook
Your online store effectiveness depends mostly on your customers, these metrics shows their interest in your resource. Thus making every effort you can interest them, your store's metrics will get improved.
I hope this post will help you analyze more effectively reports of analytical tools and perform diagnostics of your store's/websites productivity. What's more at the end of the article there are featured several must-read articles and blog posts about key metrics and their optimization. Let's rove!
Image Source: Keyboard photo by Shutterstock
Key metrics are a rating system, which help any online store identify strategic and tactical goals. Use of key performance indicators enables each ecommerce resource assess their condition and assist in evaluating the implementation of strategy. Key metrics allow take control over all the activities of the company.
Each website is unique; each and every has its own mission, its goals and targets. Therefore, every company must take into consideration their unique metrics to measure productivity. These metrics are called key performance indicators.
Key performance indicator is a metric that helps assess effectiveness of achieving the goals.
In addition to unique metrics for each company there are universal metrics that will be relevant to any ecommerce store.
These metrics include:
- Visits and visitors;
- Time spent on site;
- Bounce rate;
- Indicator output (exit pages);
- Conversion rate.
Visits and visitors - this is the fundamental metrics used to determine all other metrics.
This metric includes two parameters: visits (sessions) and unique visitors.
Visits (this metric is called the session) - shows the number of visits during the selected time.
This parameter is calculated really simply. When the new visitor comes to the website analytical tool with a cookie file, opens a new session. The session is closed when user leaves the site or was not active (does not click) on the site more than a certain time (usually 29 minutes). User can make several visits a day.
Unique visitors - this metrics shows the number of people who visited your website during certain period of time.
This metric is calculated as follows. Each new visitor is assigned unique ID that is stored in the cookie file. The next time you visit this user ID is not case sensitive.
For example, the same user can visit website several times. For example,user came to the home page of the company that promotes websites, he visited homepage, then about us page, and all of a sudden his phone rang, than he walked away for 31 minute. Later he returned and continued browsing the website, he entered the page of a specific service, checked out the price, and then left.
This is what analytical tool stores:
Visits - 3
Unique Visitors - 1
Time spent on a website - this metrics shows the amount of time visitors spend on a separate page on the site during a session.
This metrics includes following parameters:
Time spent on a page (T (p));
Time spent on a website (T (s));
Assume this, visitor came to your website at 9.00AM, at 9.01AM he entered the About Us page scanned the info and in 9.05AM entered the Contact Us page, this is what we'll get as a result:
T(p1) = 9.00 - 9.01 = 1 minute
T(p2) = 9.01 - 9.05 = 4 minutes
T(p3) = 9.05 - N/A = 0 minutes
T(s) = 1 + 4 + 0 = 5 minutes
That's why, if the user visited only one page in the report we overall time on the website 0 minutes.
Bounce - metrics that shows the percentage of sessions visit the web site, in which only one page was viewed.
Assume the rate is somewhere near 70%. it means that 70 people out of 100, for some reason are not interested in your website, that's why they have not made even a single click.
Conversion rate - metrics that shows the number of targets, divided by the number of unique visitors.
This metric should be treated wisely. Each website has its own goals, and the percentage of their achievement is the most important indicator of success.
***
If you want to be sure that you shop runs fine you need to keep an eye on your metrics and make sure that you’ve done everything according to the following plan.
First, segment your data:
- Traffic Source / Channel / Campaign: where the users came from (links, email, SEO, and PPC) affects their behavior on the website.
- Product Category: the more goodies you sell, the more variation you'll see.
- Time: don’t forget to track seasonal changes. The best choice will be weekly trackings.
Metrics to look after:
- Average Order Value;
- Average Order Profit;
- Cost Per Acquisition: how much can you pay for the sale?
- Conversion Rate: level of efficiency of your website when closing the deal;
- Customer Lifetime Value: can you afford to pay a lot for an acquisition, knowing you can make up the money over the next x months?
- Repeat Purchase Rate: related to CLV, allows to get more profit;
- Revenue Per Visit: “getting the most out” of your visitors;
- Customer Satisfaction Rate or Net Promoter Score: are you getting orders or are you getting customers?
- Demographics: even at a high level, it provides some customer context.
Ask the right questions, metrics are meaningless without actionable insight.
- Identify your most important channels for revenue/acquisition, find opportunities;
- Identify your best selling and most profitable products; prioritize them but also figure out why your other products aren't doing better;
- Identify which products are purchased together to uncover merchandising and bundling opportunities;
- Test offers to determine what drives your goals: shipping, guarantees, upsell, discounts, etc.
- Isolate conversion barriers and tune them all down;
- What's the best way to increase revenue by 10% for your business: increase traffic by 10%, increase conversion by 10%, or raise prices by 10%?
- What are the 50%, 80%, and 95% scenarios? Means, edge cases, and subjective priorities can mislead you from the bigger picture.
***
Now it's time to get deeper into this subject, here we've selected some interesting resources on this very topic, feel free to check them out!
3 Key Metrics for Evaluating Your Mobile Ecommerce Site
- Understanding the ABCs of Mobile Metrics;
- Impact of the Tablet;
- How Do Your Numbers Stack Up?
***
How Do Social Login & Sharing Affect Ecommerce?
- Use social login to avoid shopping cart disruption;
- Become more relevant with social sharing;
- Increase key metrics.
***
Getting the Most Out of Google Analytics
- Setting up your Analytics profile.
- What’s a segment?
- What does your site do?
- What a visitor can tell you?
- CSI your website
- Custom reporting
***
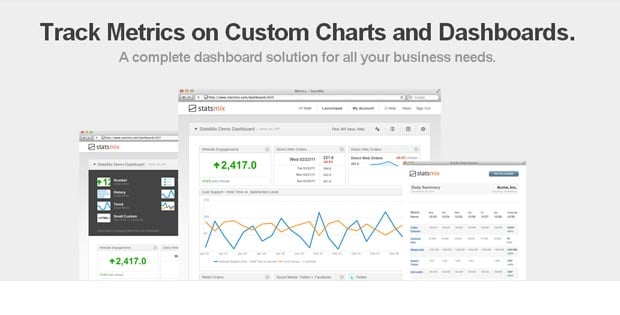
Track Metrics on Custom Charts and Dashboards
Quickly track, chart, and share any metric. From application to business metrics, create dashboards to better understand your business.
- Include Third Party Services;
- Instant Trend Charting;
- Easily Create Dashboards;
- Daily and Weekly Email Updates;
- Share Dashboards & Charts with Anyone;
- Receive Alerts;
- Notes on Charts;
- Custom Branding of Charts & Dashboards.
***
How to Define Key Performance Indicators for Your Websites
- B2C (Business to Consumer);
- B2B (Business to Business);
- Content Sites/Blogs.
***
6 KEY Online Marketing Metrics
- Money Metrics;
- Visitor Value Metrics;
- Marketing Metrics;
- Navigation & Usability Metrics;
- Performance Metrics;
- Environmental Review Metrics.
***
Actionable Metrics in eCommerce
- Define your business objective;
- Define and set up your goals & KPI’s;
- Segment your traffic;
- Study & Act!
***
I hope that I've been able to introduce you basic metrics of web analytics. In addition to these standard performance indicators, there are lots of other interesting ones that we are going to run over in the following publications. Stay tuned.
***
Got something to say? There is a "Leave a message..." square at the bottom of a page, feel free to use it.
The Ultimate Step-by-Step Guide To Your First Online Store [Free eBook]
Get more to your email
Subscribe to our newsletter and access exclusive content and offers available only to MonsterPost subscribers.


Leave a Reply
You must be logged in to post a comment.