


Simplicity is the way to go when communicating. You convey ideas efficiently and effectively. People understand quickly and appreciate your directness. Good Business reporting needs this direct approach.
A business report has information that is structured or formatted, and presented to an audience. Fellow employees, a boss, investors or members of the strategic team consume your accurate information and use it to make decisions. Sometimes the reports just inform of the achievements and goals of the company.
Business reports take many forms. Some are several pages long with an executive summary at the beginning. Most people are familiar with annual reports, which are comprehensive reports, holding information about the financial performance and business activities, for the entire year.
Management teams are constantly searching for interesting ways to present these reports to various audiences: this is where PowerPoint can help.
Presenting Business Reports with PowerPoint
For over 20 years, professionals in all industries have trusted PowerPoint for presentations. Why? PowerPoint lets you communicate successfully! It helps you to eliminated clutter, and focus on the main points. You get to use multimedia files such as videos, pictures, charts, sound bites, animations in business report presentations. Multimedia files add flavour to your presentation so that there are never dull. This keeps your audience engaged.
Despite the widespread use of PowerPoint; few people have truly discovered its best features. In the process, they miss out on making their presentation truly exceptional.
How Come?
Yes, good question. We chiefly use PowerPoint to present static info and ignored its capability to support dynamic info.
Static info is data your input when creating slides and it never changes. For instance, text, figures for creating charts, pictures, videos, etc. If you need to change anything, you must go back and edit the slides.
Dynamic info is the opposite of static info. It changes on its own. You don’t have to make any changes to the slides. Once you design the slide elements, you link the presentation to an external source of data. In short, you make presentation intelligent.


Importance of Dynamic Data in Business Reporting
Business reports are more than a grouping of factual information into an introduction, body, and conclusion. The report must fulfil the business purpose. Most reports convey past information for decision making or to solve a problem.
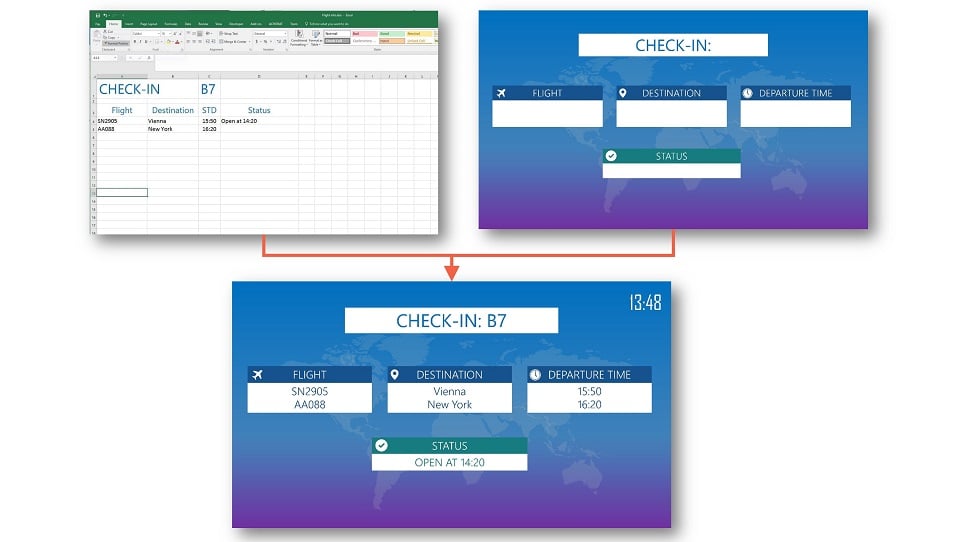
Would it be better if this information was up to date or real time? Let’s take a scenario, where an employee; say, John Head of Marketing is making a presentation about sales. Being witty, he links a page titled ”Total Monthly Sales” to a database which is continuously updated with the latest customer orders. When an order is made, John gets the most recent data, even during the presentation.
Also, PowerPoint allows him to link the database to internet data files. He can receive information from RSS feeds, social media and even weather updates. PowerPoint can also obtain information from Excel files and other data files. That’s the power of PowerPoint: Dynamic Info.
Simply put, the program is intelligent, and this is how you can incorporate dynamic info: DataPoint Technology to Link PowerPoint to Data Sources and Databases
Are you ready to make your presentations intelligent; or to update the PowerPoint presentation with the latest hourly or daily figures? You can write the code yourself. That requires an understanding of programming techniques.
If you don’t have the programming skills, worry not. The best option for you is DataPoint. It is an intelligent plugin that adds dynamic data capabilities to all versions of PowerPoint. The add-on is simple to use and updates everything automatically. You get to specify the frequency and duration of the updates. Being expertly developed and tested it runs smoothly with no errors.
Of all the programs out there, PowerPoint is the only program that displays dynamic data. It has all the architecture perfected over the years. Unfortunately, no program compares.

Capabilities of DataPoint
You can see new data when:
- You open the presentation.
- You generate a snapshot presentation (disconnected) for distribution to others that do not have access to your databases.
- Real-time information screen or message board by running the presentation as a slideshow on a dedicated monitor.
Integrations
When we told you DataPoint is terrific, we meant it. Here are the integrations that DataPoint makes possible with Microsoft PowerPoint. If you have any questions and how to perform any integration contact us for guidance.
- Microsoft SQL Server
- Microsoft Access
- Microsoft SharePoint
- IBM DB2
- Informix
- MySQL
- Oracle
- Other databases linked via OLE DB and ODBC
- CSV files
- Text files
- Facebook Likes
- Outlook
- Exchange
- Excel
- SharePoint
- Yammer
- XML
- JSON
- oData
- RSS
- Yahoo Weather
- Yahoo Finance
- Google Calendar
- Google Sheets
Save Valuable Time by Using Templates
Without a doubt: Most people dread giving presentations. Despite lacking design skills, you will love PowerPoint. All you need is professionally designed templates.
What Are Templates?
Templates are pre-made themes with the right layouts, backgrounds, fonts, colours, font size, and content. They are sort of blueprints you use to come up with impressive business report presentations.
Check out the following pro templates:
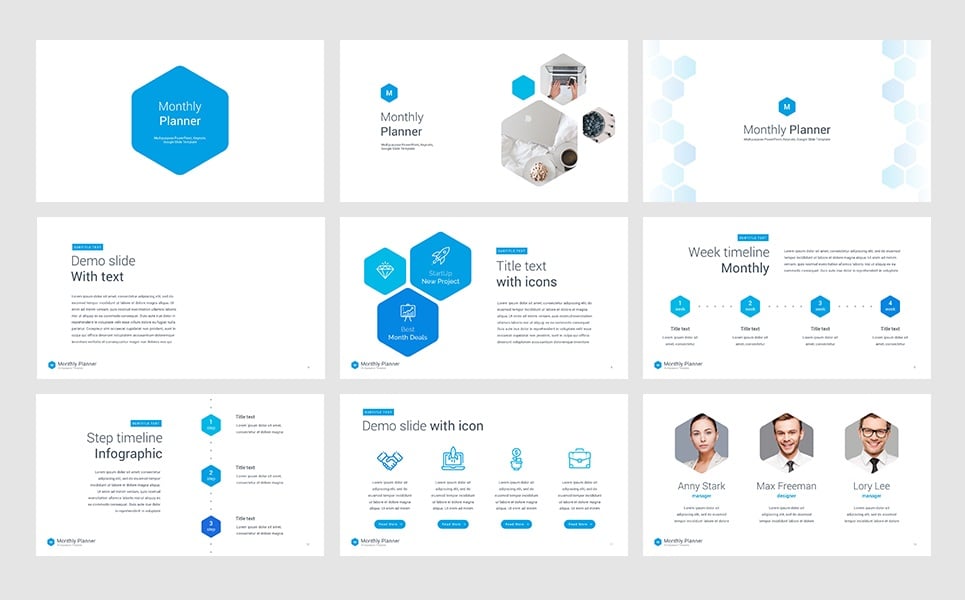
Monthly Planner PowerPoint Template

Or maybe this
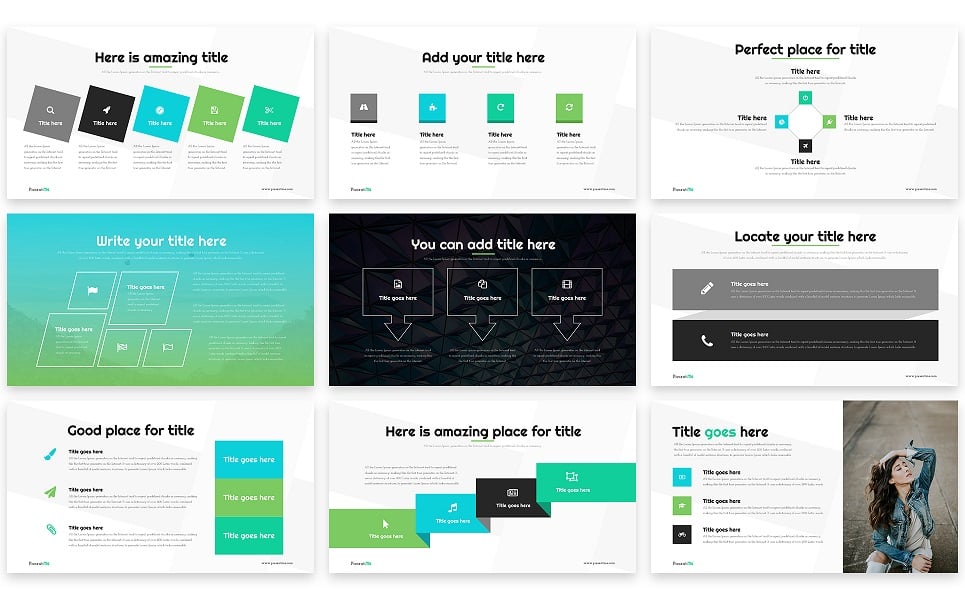
Amazing Figures PowerPoint Template
To use them, download and open the file using your PowerPoint program. Next, change the text boxes by adding company-specific information.
How to link to data sources: We have excellent video tutorials to help you get started. Also, you can read the following posts;
- How to Link PowerPoint to Microsoft Access Databases
- Data scrolling or the use of virtual slides in PowerPoint
- How to Use Data Scrolling or Virtual Slides in PowerPoint
Presentation Maker Tool
When using DataPoint remember to use the presentation maker tool. What does it do? This tool is just an option in DataPoint that allows you to scroll through the database and refresh the information you display to users, without the need of creating additional slides. You can read about the option on the Data Scrolling Virtual Slide article.
Summary of the Benefits of DataPoint Integration with PowerPoint
- Gives decision-makers better insight
- Enhances the credibility of reports
- Thus, supports decision making
- You can create a video from the presentation
- Makes the presentation interesting through use of multimedia
- Creates a lasting effect on the audience
- Promotes simplicity and understanding
- Reports are appealing
- Makes reports more factual
- Templates are visually striking and consistent
- Never worry about outdated data
- Build once and reuse
Bottom Line
Straightaway give your presentation that extra spark. Using our detailed articles, video tutorials, and technical support, you will soon use DataPoint with ease. Not to worry, the add-on is friendly and comfortable to use.
DataPoint allows you to use PowerPoint in ways you never considered possible. For instance, creating dynamic Digital Signages. You can even display presentation on more than one screen. Furthermore, you don’t need any graphic design skills to use DataPoint or PowerPoint.
If your organisation has been searching for a simple but powerful way to display business reports, search no more. Use DataPoint for all presentations and Digital Signages. Contact us to learn how we can help your reports shine.


Read Also
Featured PowerPoint Templates And Themes
6 Rules of a Compelling PowerPoint Presentation
PowerPoint vs Keynote: Presentation Tools Compared
Create A Skillful Presentation Of Your Freebie With This Free One-Page WordPress Theme
7 PowerPoint Template Designs We Adore In 2017