

Decision makers always have a crucial role to play in any form of business. They have to prove their judgment ability and Intelligent Quotient (IQ) with relevant facts and figures. A tool that actually transforms data into information and information into presentable business format can help them do so.
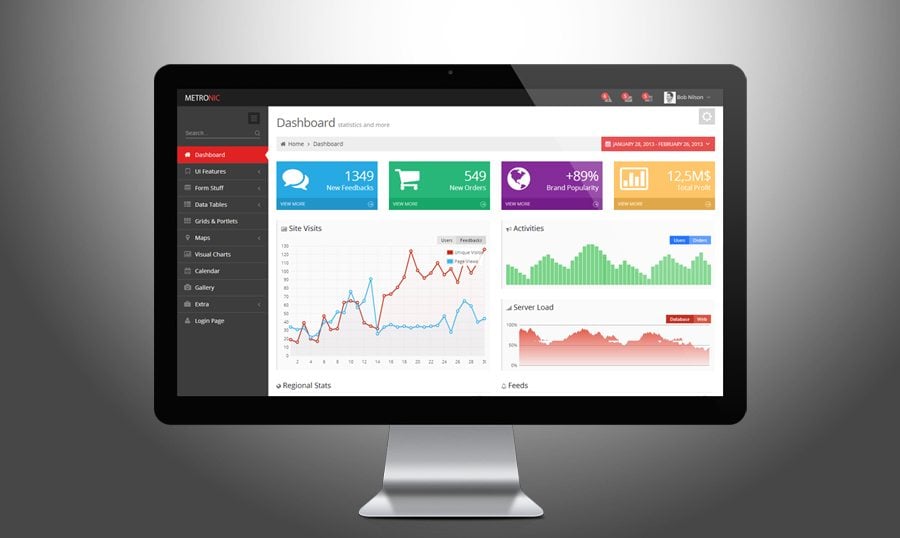
Dashboard is undoubtedly one of the most preferred Business Intelligence (BI) tools these days. Such a popularity is not because implementing business dashboards has become cheaper and easier than ever before. Rather it is the efficiency, usability, and decisive nature of a dashboard that counts the most. With customized dashboards data analysis and interpretation become easier, quicker and relevant.
If you think that dashboards are just for managers and senior executives of large companies, you may go wrong. The concept of using dashboards based on user roles or hierarchy has changed now. Employees at each level of their jobs and job positions need to measure their KPIs and performance metrics related to company’s goals. This involves both qualitative and quantitative measurement of data coming from diverse resources.
[related_posts]
Know Your Dashboard Types First
Depending on the area of use, there are three general types of dashboards – Strategic, Tactical, and Operational. Senior executives use Strategic dashboards to monitor company’s progress in achieving common strategic goals. Tactical dashboards are for managers that help them gain deeper insights into company’s actions. Operational dashboards take a much closer look at the detailed analysis of departmental processes. Manufacturing, Sales, Services, Human Resources, and Finance - each of these departments needs operational dashboards in day-to-day business activities.
In this article, we will look at the common and popular usage of dashboards in real-life business situations.
- Dashboard for Marketing Insights and Web Analytics
In any organization, marketing and web analytics team depend on a multitude of data that comes from various channels. A marketing manager needs to collate and assort all the raw data, present it in an understandable format and finally analyze them from various aspects. Performing all these steps manually is labor-intensive and error-prone. Moreover, representing marketing data as per company’s strategies and goals needs centralized control over data repository and configurable data display option.
With dashboards facility, you can monitor the key metrics of SEO campaigns, email campaigns, newsletter subscription, keyword ranking and any other marketing programs that you are running. Your website analytics team can also track visitor trend, traffic source, behavior and other important web appearance related parameters. This helps you demarcate between what works and what does not work.
- Dashboard for Tracking Sales Opportunities
Sales dashboards allow you to investigate various aspects of a sales process throughout its lifecycle. You can keep a track of top sales opportunities and monitor sales funnel on a periodical basis. With configurable dashboards, sales personnel can compare the growth in their list of prospects and revenue from time to time. Dashboards are also useful to someone in a managerial position who needs to present sales data during quarterly and annual meetings. With sales dashboards in place, there is no need to spend countless hours in preparing multiple excel sheets, trend charts, and manual entries.
If the senior management needs you to report on ‘Projected vs Actual’ and your team needs you to draw a baseline for them in order to track monthly performance, sales dashboards are just the right fit.
- Dashboard for Social Media Management
Managing multiple social media accounts using different login access is a cumbersome process. Isn’t it a great idea if you can access and operate all your social media accounts from a single, user-friendly interface and create customized reports in simple mouse clicks?
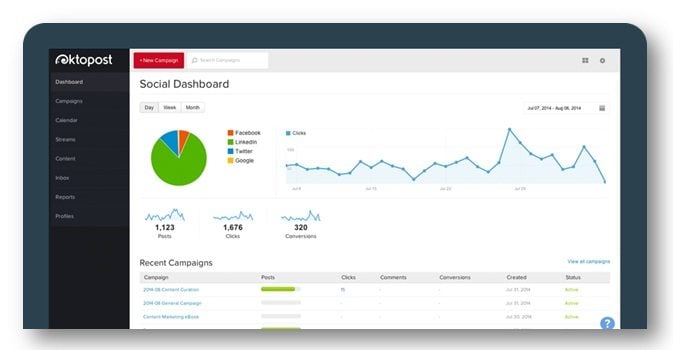
With a comprehensive social media management dashboard, you can manage Facebook, Twitter, Google+, Instagram, LinkedIn, Pinterest, Vimeo, YouTube and other popular SM accounts all at once, the way you want. This saves time, effort and helps you focus more on producing better marketing content than managing login areas and creating presentable reporting format for board meetings. Oktopost.com is a good example of a social media management platform specifically tailored for B2B marketers.
Social media managers require a comprehensive SM solution that not only tracks followers, shares and likes, but also provides analytics to evaluate the team effort and subsequently generate leads. Isn't it easy to measure your social success by viewing a simple graph like the one given below?

- Dashboard for Financial Reports and Metrics
The data representation format in any Finance department is so complex that it often leads to misunderstanding and misinterpretation of critical data. With dashboard facility, finance managers and financial analysts can explain critical and sensitive data in the most convincing way. You can show revenue chart in graphical format, departmental budget in pie charts, balance sheet and expenditure in bar diagrams and do more. Managing customer invoices and business expenses; preparing accounts related summary; tracking revenue goals – all are possible with finance dashboards.
- Dashboard for Project Updates
Project management is one of the critical job roles in any organization that demands higher level of reporting, intelligent projections and better resource utilization. A project manager needs to prepare a plethora of reports on To-Do lists, project completion schedules, team structure, resource consumption status and keep senior management up-to-date. With project management dashboards, it is possible to get a bird’s eye view of ‘what, when and why’ in an organization.
- Dashboard for Project Collaboration
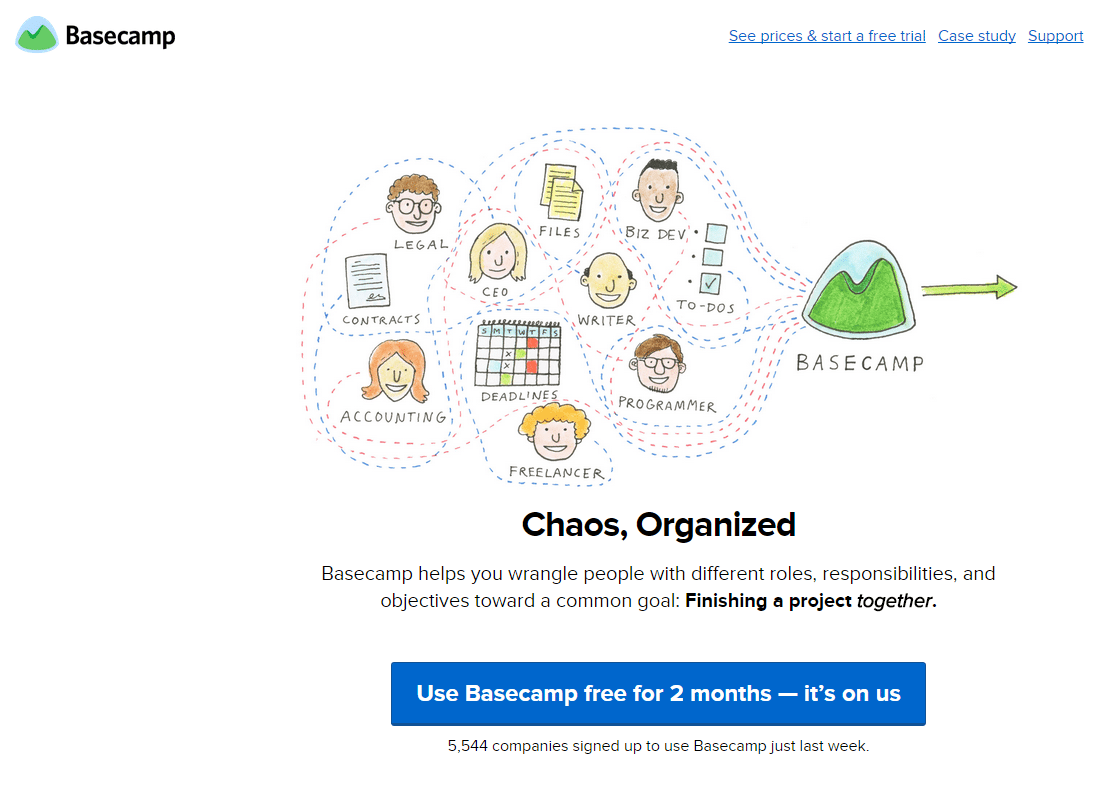
Online collaboration is the must for any small or large-scale project involving multiple stakeholders of multiple departments. A project supervisor needs to get people together, give them an overall insight of the project, schedules, deadlines, responsibilities and keep them involved throughout. With project management dashboards from Basecamp, Trello, Smartsheet and similar web based tools, you have someone to take the pain of doing both watchman’s and postman’s job.

- Dashboard for Network Monitoring
Dashboards act as good visualization tools for IT and networking people in an organization. Whether you need to monitor server records or update teams about server uptime, downtime, load status, site speed and server users’ statistics, dashboards can organize all the data real-time and display them in a consolidated graphical format. Server health monitoring and day-to-day reporting become convenient with good use of IT dashboards.
- Dashboard for Service Management
Every service based company needs to deal with customer complaints and keep a track of support calls and complaints on a monthly basis. This requires managers and employees to maintain loads of excel reports manually, which is incompetent by process and time consuming. With dashboard representation of customer support data, it is easier to analyze and improve service efficiency on a micro level.
- Dashboard for Client Monitoring
If you are facing a problem in monitoring multiple client accounts, and wish to get necessary alerts and notifications from key accounts, dashboard is the one-stop-solution for you. Dashboards make your job of updating clients on real-time project status easier. You can simply configure a dashboard containing necessary reporting widgets and send automatic email alerts as and when required.
Moreover, you may update your client about AdWords metrics, keywords ranking, website visitors, top Tweets or Facebook posts - all in all in a single dashboard. It is convenient for both the manager and his or her client to be in the same page of information. Most importantly, dashboards provide a well-organized platform of communication to both the parties and help them understand and work on the key evaluation points.
- Dashboard for Team Motivation
Dashboards, if managed properly can actually improve team efficiency a lot. Yes, you don’t necessarily need to raise compensation or reduce work hours to motivate a team. Instead, you may offer them a multi-tasking dashboard solution that helps them spend quality time on work. Once they experience how to find new trends, how to focus more on data-driven results and how to align their strategies with company’s goals they will feel inspired. Optimized use of dashboards can actually develop sense of belongingness within a team and empower them to deliver more.
- Dashboard for Team Productivity
Process automation, team collaboration and project transparency are the key factors in improving team productivity. Modern dashboards can automate collateral tasks, reduce number and frequency of reports and produce dynamic insights that save time and effort. Since intuitive dashboards are easy to learn and apply, team members can quickly adapt to the new way of managing things. It is always good to surprise your team with something better that they can use for self-improvements.
Now when you are planning to implement this dashboard facility across the teams and departments in your organization there is another step to follow. You need to select a vendor that provides you highly configurable and intelligent dashboard solution. Selecting ‘Any’ may not serve your purpose. Here is a checklist for a quick understanding.
Your dashboard solution must provide you with:
- Multiple integrations with popular 3rd party tools and systems;
- Highly configurable widgets with drag-and-drop feature;
- Custom widgets for supporting CSV file, Google spreadsheets, iFrame, image files, RSS feed and text inputs;
- Advanced user management section;
- Edit, delete and copy features of dashboard;
- Export and import feature of dashboard template;
- Repository for historical data as and when required;
- Online help for troubleshooting;
- Public URLs of dashboard that can be shared with anyone virtually;
- Customized and exclusive features for scalability.
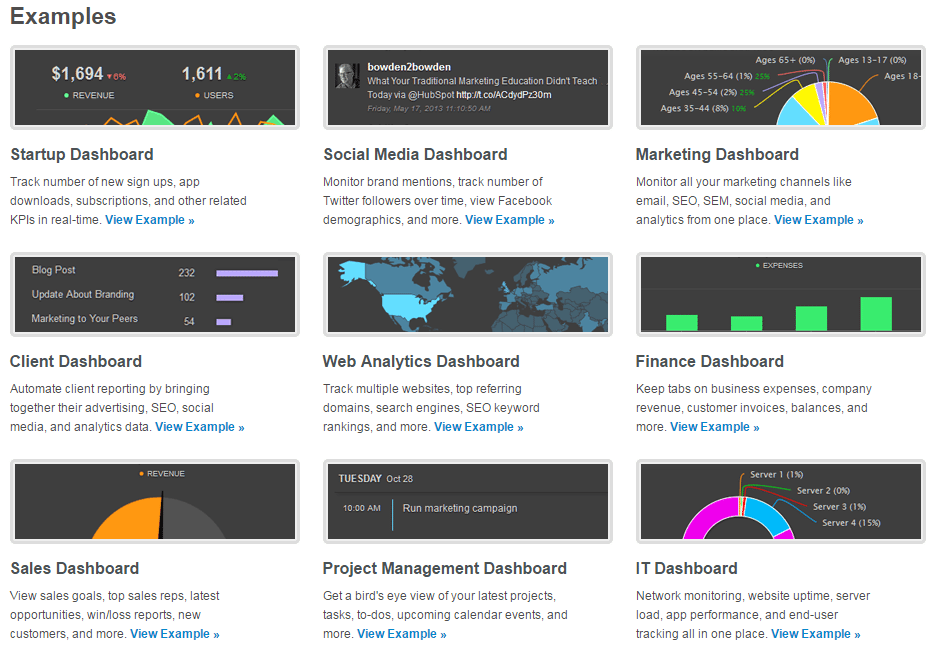
You may check out Cyfe for several examples of business dashboards and custom widgets. This will give you an idea of what a dashboard is capable of and how it may help you make better and informed decisions. More the number of widgets your dashboard system support more you can integrate with 3rd party applications.
For example, with Cyfe you can actually integrate your dashboard system with more than hundred popular applications of various business needs. All that you need to do is to select a list of preferred widgets in a simple drag-and-drop manner and work in an integrated dashboard setup. The diagram below illustrates several examples of business dashboards.

No matter what dashboard solution you pick up and implement in your organization, it needs to work the way you want. Dashboards can save several business hours in a day provided you know how to implement them and where.
If you are not confident about using dashboards, just go for a free trial online and ask as many questions to your vendor as you can. There are a plenty of dashboards solutions available in the market today. Just sit down with your seniors and teammates for a couple of sessions and understand their expectations from this new management solution. Once your team expectations match with dashboards capabilities, rest assured you have the right solution.
For detailed analysis of what dashboards can and cannot do, you may ask for live custom demonstration to your vendor. A good and reliable vendor should provide you such complimentary support before you sign up.
If your website already has an admin panel and you want to work on its design, review our Bootstrap Admin Themes.