Do You Make Mistakes in Your Code? Use Web Debugging Tools and Resources for Testing Layouts
Even the most skillful web development professionals make mistakes from time to time. You know, coding is a complicated thing. There is always a chance that something will go wrong right after you think that the project is finished.
So, testing a website that has been already coded and is running in a browser can hardly be called an excessive desire to play safe. Take your time and check your HTML, CSS, or JavaScript to ensure full compatibility with all browsers and good rendering on all popular screen sizes.
In truth, web technology is in constant process of development, so now it’s much easier to debug your site and test its layout then it was, say, a year before. More and more new, advanced tools and resources appear each day for the purpose.
And this blog post should be rather helpful if you are going to debug your site, by the way. It contains more than 20 current web debugging tools and resources. With their help you will be able to see how your website looks and performs in different browsers and on different screen sizes.
The tools listed below will also show you the errors in your code, identifying potential issues that may become harmful in future.
So, are you ready to check your layout and find out a couple of bugs in your code? Then, look through the list below and pick out the tool that fits you the most.
* * *
Tools for Code Validation
The Debug tool window displays the output generated by the debugging session for your application. If you are debugging multiple applications, each one displays its output in a tab named after the corresponding run/debug configuration.
* * *
Want to check the markup language of your web documents? Use this validator tool. It checks the markup validity of documents written in HTML, XHTML, SMIL, MathML and others.
* * *
The tool serves for Cascading Style Sheets (CSS) and (X)HTML documents with style sheets check. Now you can try the W3C Validator Suite™ premium service. It checks the entire website and evaluates its conformance with W3C open standards to identify the weak points of your website.
* * *
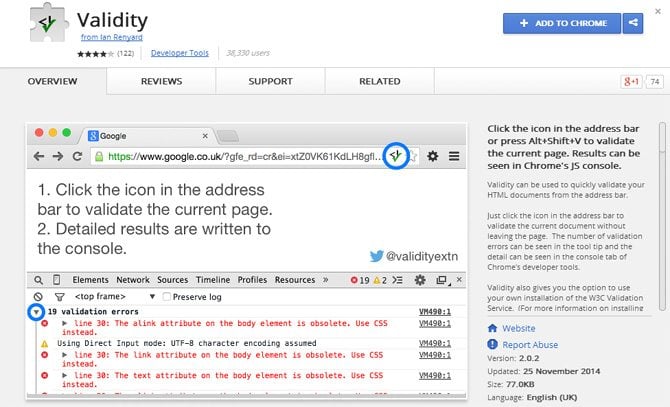
This tool is used to validate your HTML documents from the address bar. Everything is simple. Just click the icon in the address bar to validate the current document without leaving the page. The number of validation errors will appear in the tool tip and their details will be seen in the console tab of Chrome's developer tools.
* * *
Checking the Design Responsiveness
Enter you site URL into the field at the left top corner of the page and see how it will be rendered on different device screens.
* * *
Here you can see how your website will look on the screens of the most popular devices.
* * *
Browser Support Check
Ghostlab
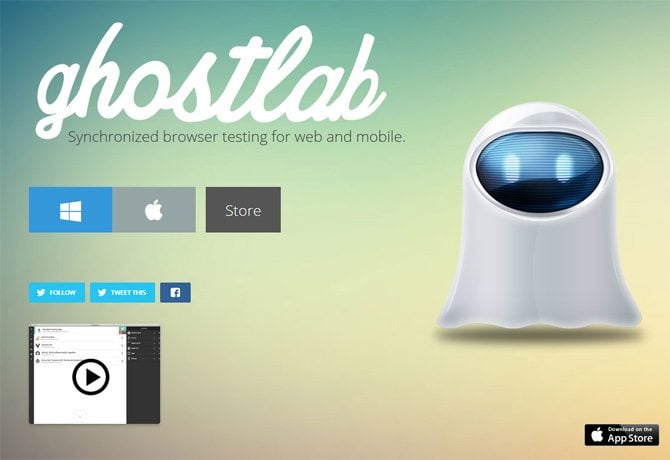
Use Ghostlab to make sure that all your users get the same great experience whatever operating system, browser or smart phone they are using. Ghostlab synchronizes scrolls, clicks, reloads and form input across all connected clients. That is, you're testing not the simple page load, but the full user experience. The superior built-in inspector will get to the bottom of any problem fast. What’s more, any JavaScript-enabled client can instantly connect to Ghostlab, so no setup is required. Ghostlab will keep in touch with them to let them know of any relevant changes.
* * *
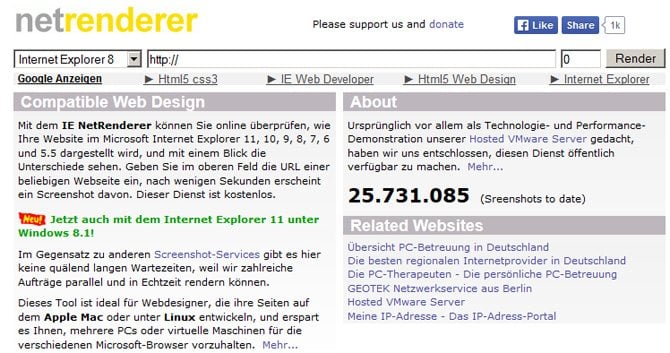
Many developers consider this service the best of its kind and rely heavily on it. It’s really a must use for most of them! You are able to have a quick look at the major IE bugs in various versions with it, which can be a lifesaver.
* * *
IE Tab for Chrome is a browser extension allowing you to use Internet Explorer to display web pages in a tab. It is useful when a web page requires Internet Explorer features. For instance you can use the IE Tab to display web pages that require ActiveX controls, test web pages with IE's rendering engine and so on.
* * *
Live, Web-Based Browser Testing
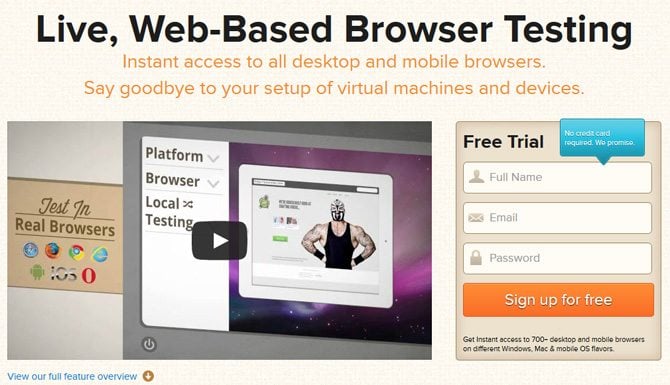
In short, the tool gives you instant access to all desktop or mobile browsers. Test live and say goodbye to virtual setup or devices.
* * *
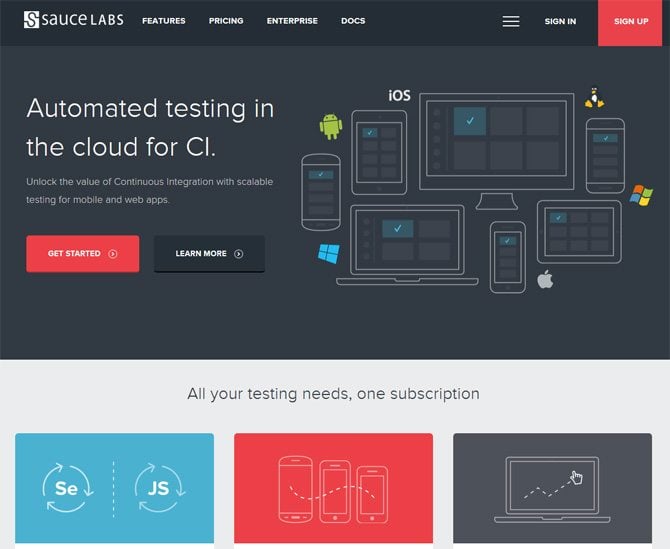
Automated testing in the cloud for CI
This tool suits for running all your tests on one powerful platform. Be they automated cross-browser, automated mobile or manual tests.
* * *
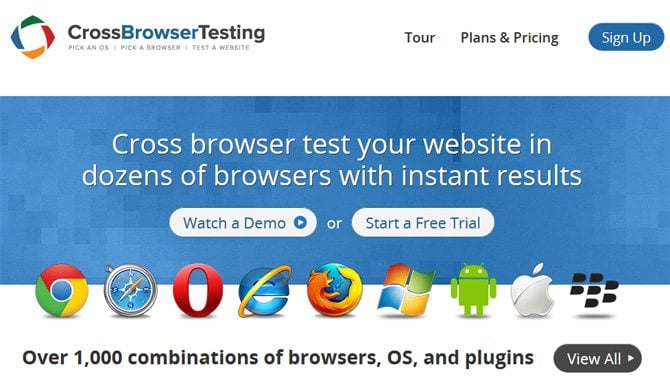
Test your website for free in dozens of browsers and get instant results. Get access to over 1 000 combinations of browsers, OS and plugins.
* * *
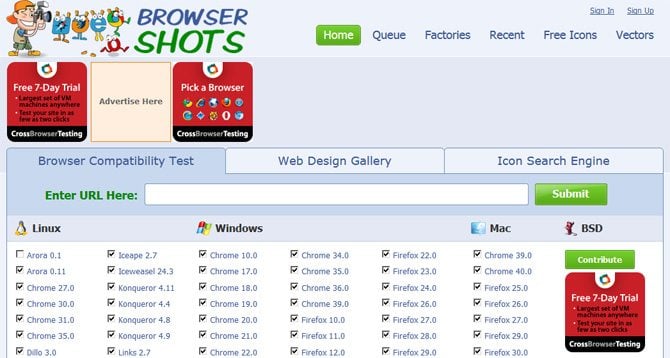
Browser Shots
Enter your website URL into the relevant field, pick a browser and check their compatibility. The service has 7-day free trial.
* * *
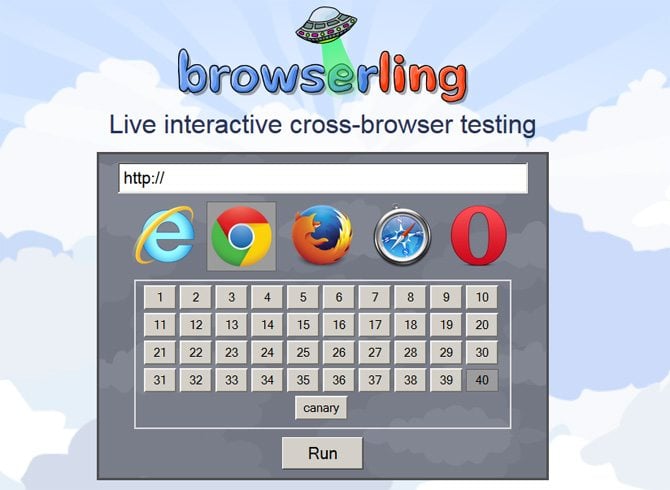
With this tool you can interact with the browsers live as if they were installed on your computer. The service doesn’t use emulators or fake browsers. You get access to the latest browsers instantly. Browserling is powered by HTML5 < canvas > and JavaScript, so you don't need to install anything else. You can reverse-proxy your local host, or local server into Browserling with their ssh tunnels. All connections between you and Browserling are SSL encrypted, that’s why your browsing is completely anonymous. Free plan is available.
* * *
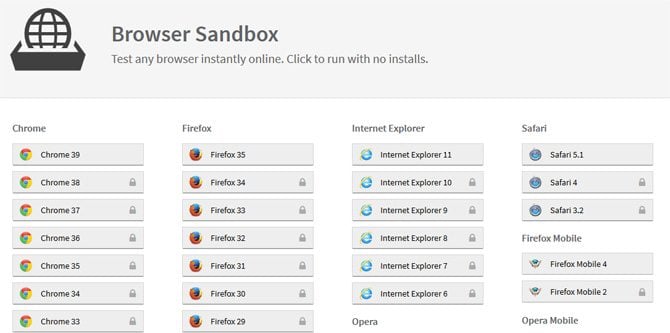
Browser Sandbox
No installs are required. Just click to run and test any browser instantly online.
* * *
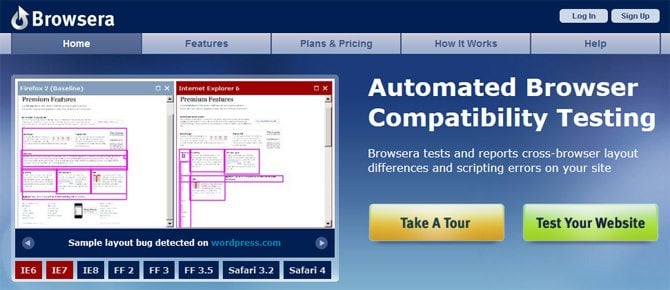
The tool is applied for automated compatibility testing. It tests and reports cross-browser layout differences and scripting errors on your site.
* * *
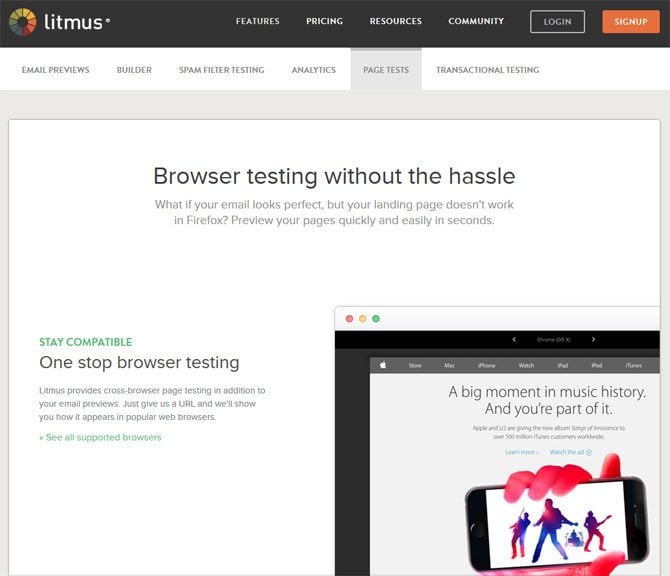
Litmus is the right tool for one stop browser testing. It provides cross-browser page testing in addition to your e-mail previews. Give them an URL and they'll show you how it appears in popular web browsers.
* * *
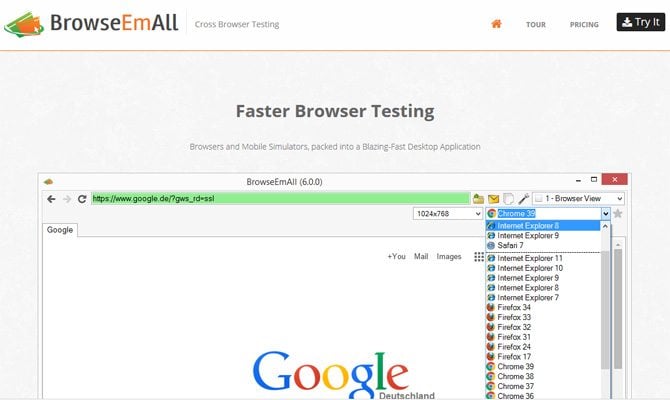
Allows faster browser testing as browsers and mobile simulators are packed into a fast desktop application. You can test for mobile: iOS, Android and BlackBerry in one application. The tool lets you find compatibility problems with ease, see browser compatibility problems directly in your code and test browsers in parallel running up to 4 browsers and mobile devices side by side.
* * *
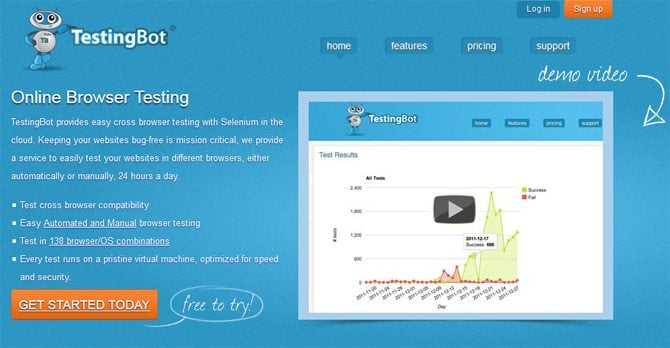
TestingBot provides cross browser testing with Selenium in the cloud. Keep your websites bug-free with this simple service, which helps to test your websites in different browsers, either automatically or manually, 24 hours a day. Free trial available!
* * *
CSS & JS Debugging
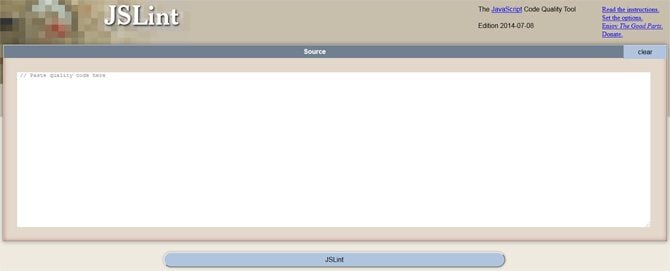
This is the JavaScript Code Quality Tool. To put it simple, it highlights problems in JavaScript programs. JSLint helps you to program in better language and avoid most of the slop. JSLint will reject programs that browsers accept because JSLint is concerned with the quality of your code and browsers are not. You’d better take its advice.
* * *
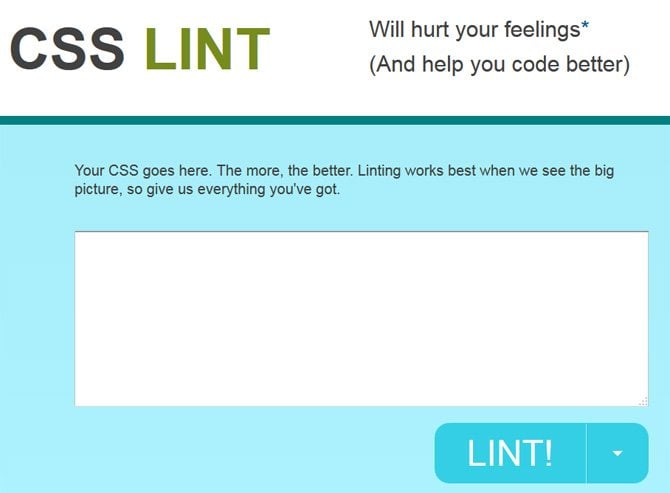
They have a very expressive slogan saying “Will hurt your feelings* (And help you code better)”. Insert your CSS into the input field and see if something is wrong with it.
* * *
Online Javascript Compression Tool
This is an online JavaScript compressor that allows you to compress and minify your JavaScript files. They are typically reduced by 30-90%. Such JavaScript files are ideal for production environments. Most of the file size reduction is achieved by removing comments and extra whitespace characters that are not essential.
* * *
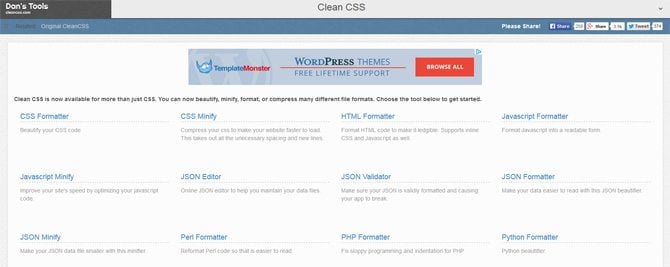
Here you will find a whole set of tools to beautify, minify, format, or compress many different file formats. Have a clean CSS that is now available for more than just CSS.
* * *
Speak up!
To wrap up everything said above, we would like to ask you several questions. Do you always test the layouts you create? Do you think it’s important? Do you find this toolkit helpful? Maybe you use some of the listed tools and are ready to share your feedback? Your comments are welcomed in the comment section.
Get more to your email
Subscribe to our newsletter and access exclusive content and offers available only to MonsterPost subscribers.






Leave a Reply
You must be logged in to post a comment.