

- Icon Types for Infographics
- How to Select and Use Icons for Your Infographic?
- Bonus: Infographic Elements Overview
The popularity of infographics has significantly grown in recent years. The reason for the high demand is that it is a powerful instrument that helps to share any kind of information with the audience. If designed right, of course.
As far as the infographics employ a strong visual content together with a precise copy, it can convey the complicated data into an easily digestible way. This makes it so popular among web designers.

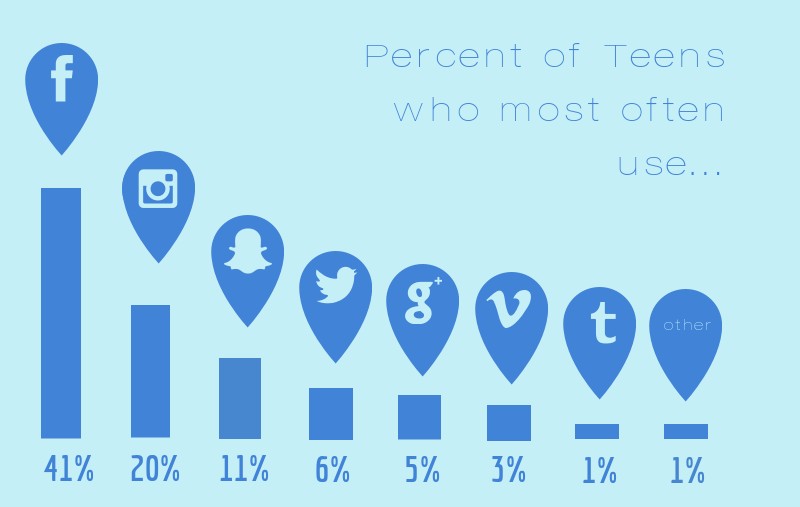
If looking at the infographics, you’ll probably notice that one of the most used elements refer to icons. Using icons within the infographics can share the information of the whole paragraph. They are perfect for representing ideas visually because:
- They add personality to a feeble graphic.
- They are easy to understand no matter what language you are speaking in.
- They are easy to customize, so you can always change their color and size to fit the certain infographic.
- They enrich visual communication.
Although, picking the right infographic icons sometimes becomes quite challenging, even if you are a professional designer. The accurately chosen icons can make a huge difference in how the audience perceives the information. Whereas, leveraging wrong icons will endanger your message along with the time and effort you’ve put on creating the infographic.
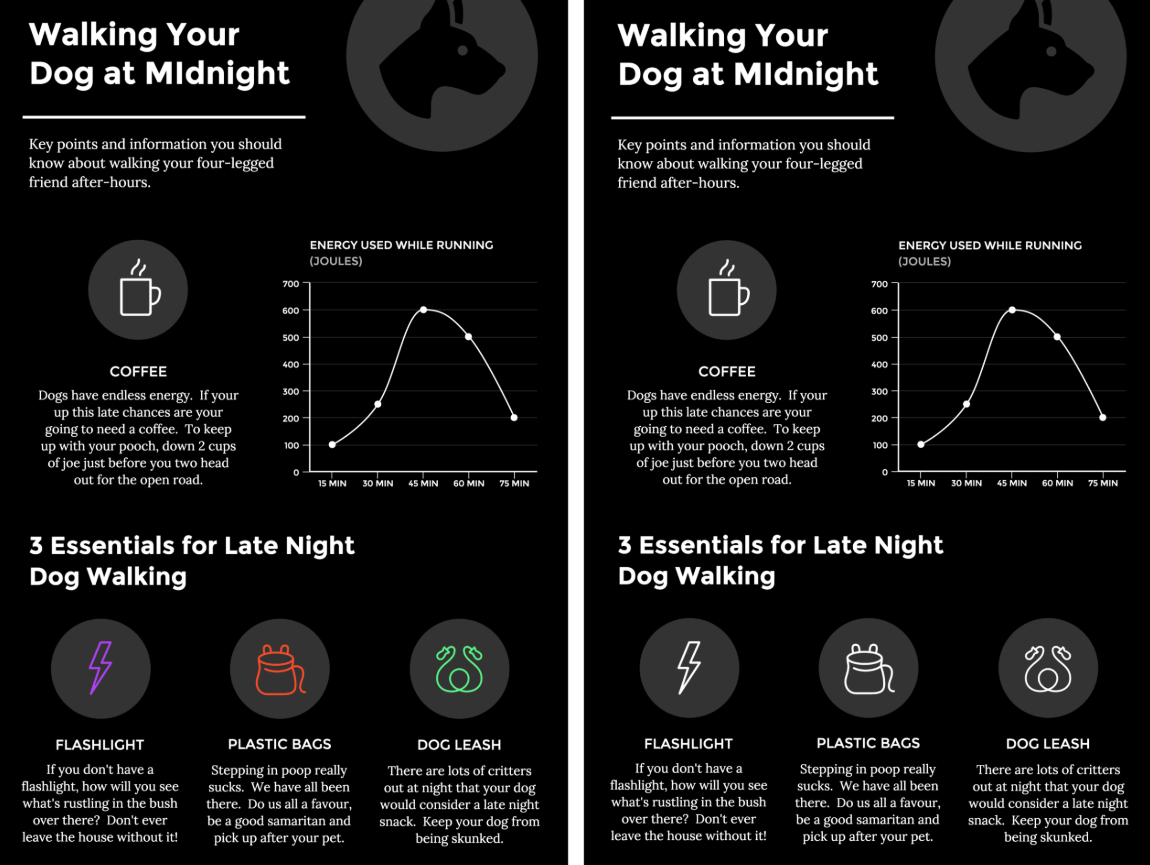
To make the most of the icons, consider this expert guide that will let you know how to use them correctly. But before moving on to the tips, have a look at the great icon usage.
Icon Types for Infographics
Like many other elements of infographics including color palette, fonts, logo, and images, vector icons are just as important. They come in several different styles, like:
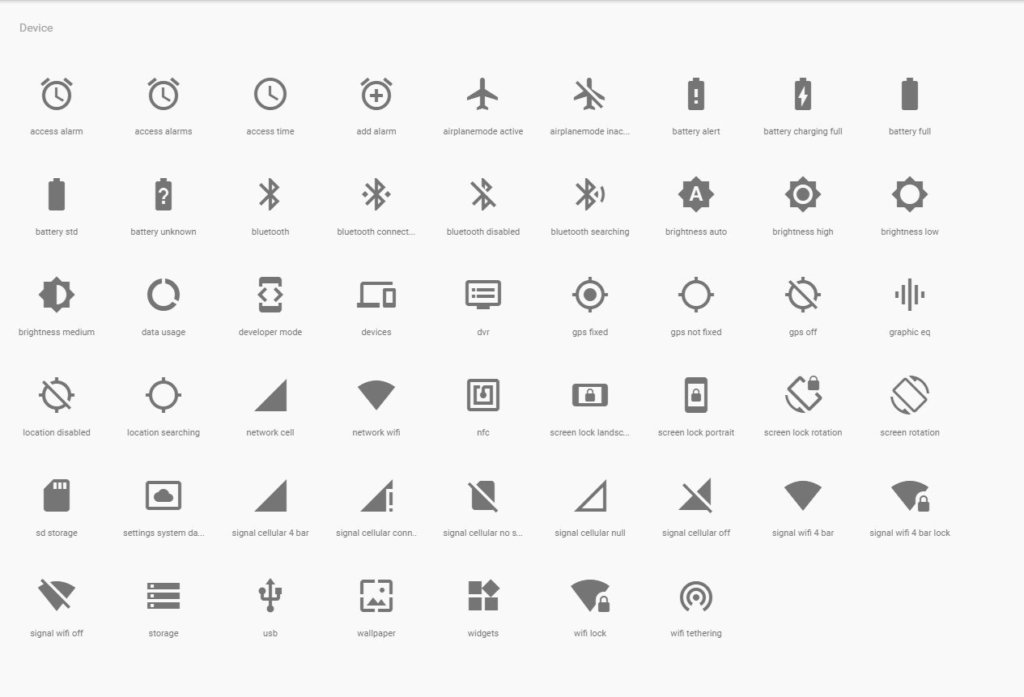
- Glyph icons are graphic symbols that determine the appearance and shape of a character. Because they use simple and universal shapes, they are perfect for a responsive design.
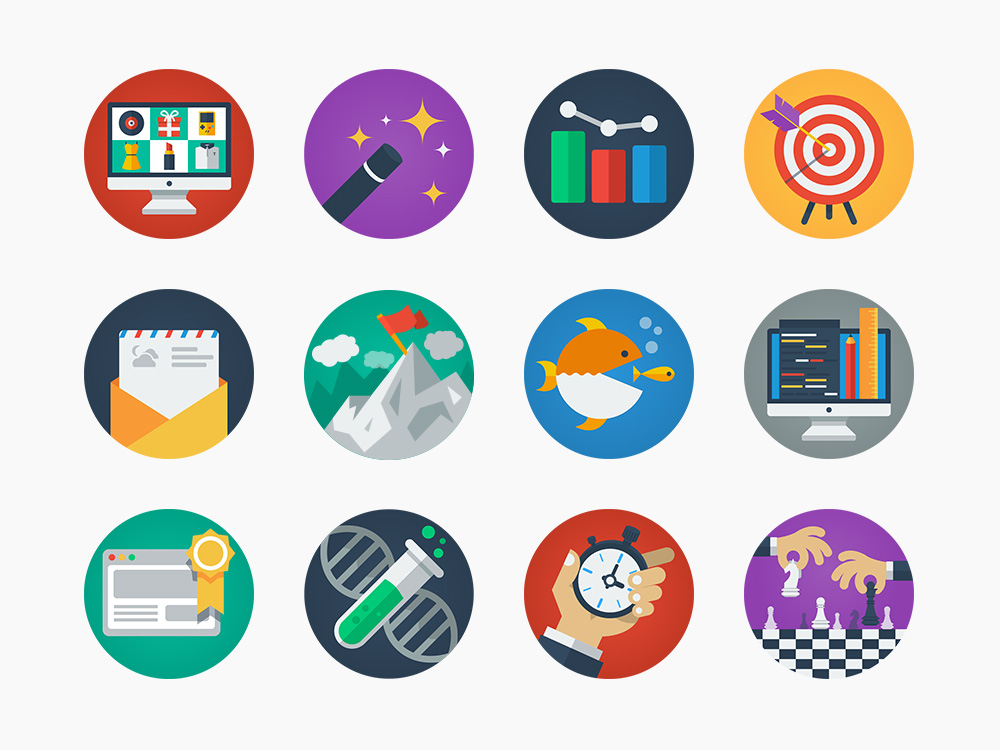
- Flat and semi-flat icons are more complex compared to glyph ones. They add combinations of color, filling elements, and a bit more naughty images.
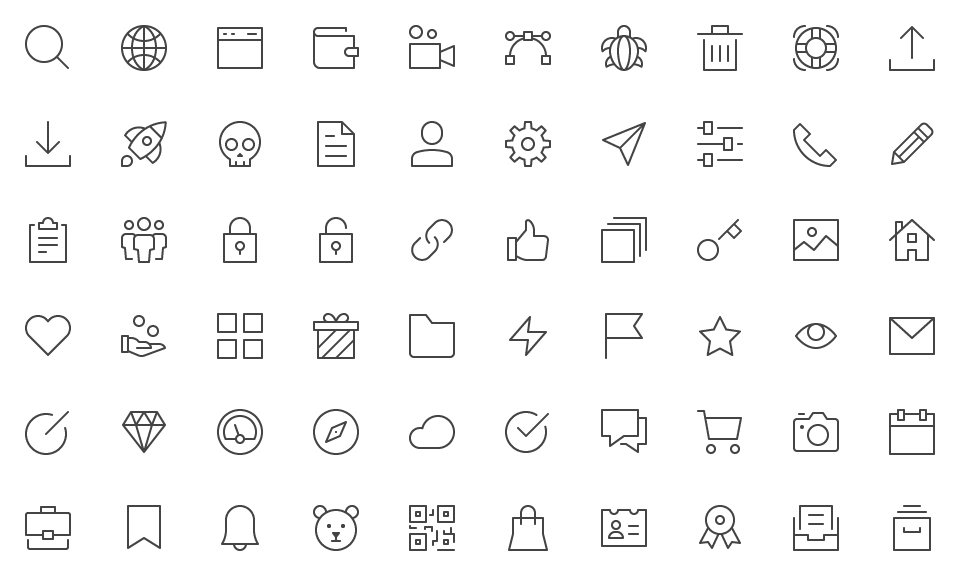
- Outline icons, similar to glyph ones, are perfect for creating a clean and simple design.
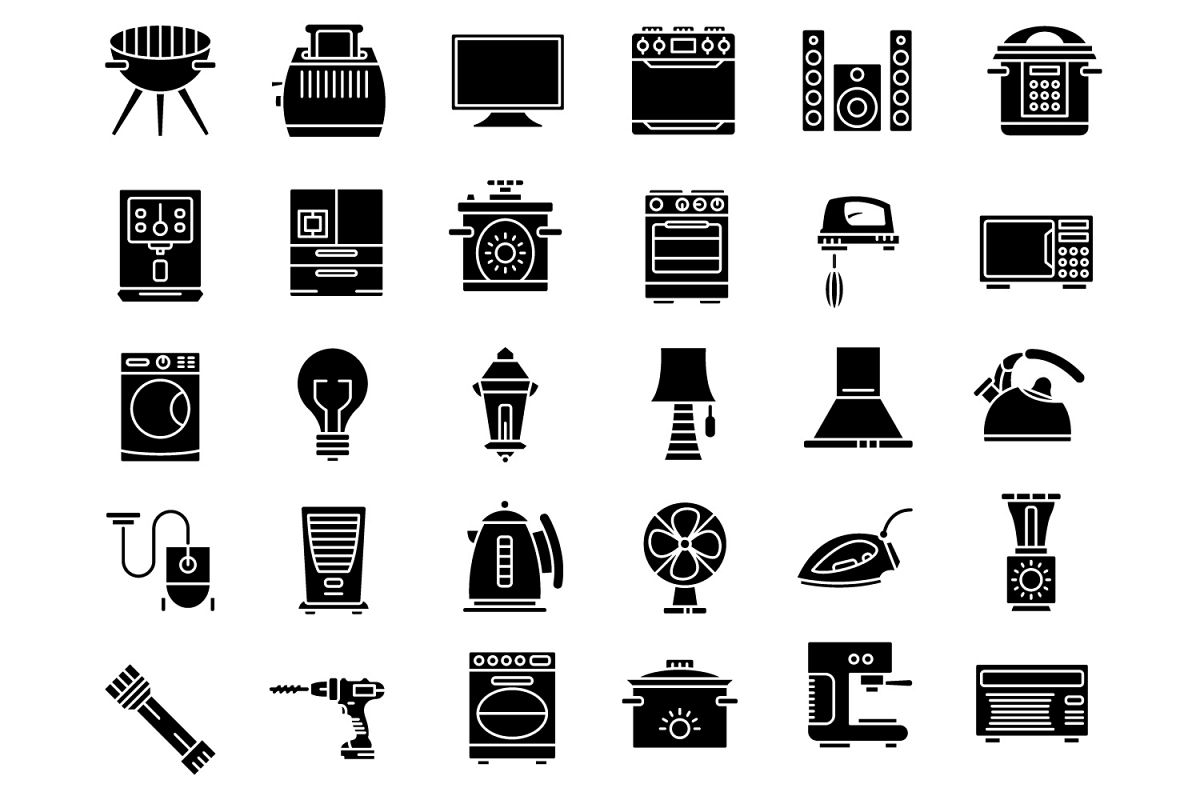
- Filled-in icons are just like outline ones but filled with color. They are more recognizable and visually attractive to the human eye because of the color.


Now that you know the standard icon types, let’s see how you can supercharge them.


As soon as you get equipped with an icon pack, it’s high time to find out how to select and leverage it for your infographic.
How to Select and Use Icons for Your Infographic?
To avoid a lot of wording in your infographic presentation and add more visuals instead, consider the following list of tips. They will help you organize the infographic icons effectively and save you time and effort.
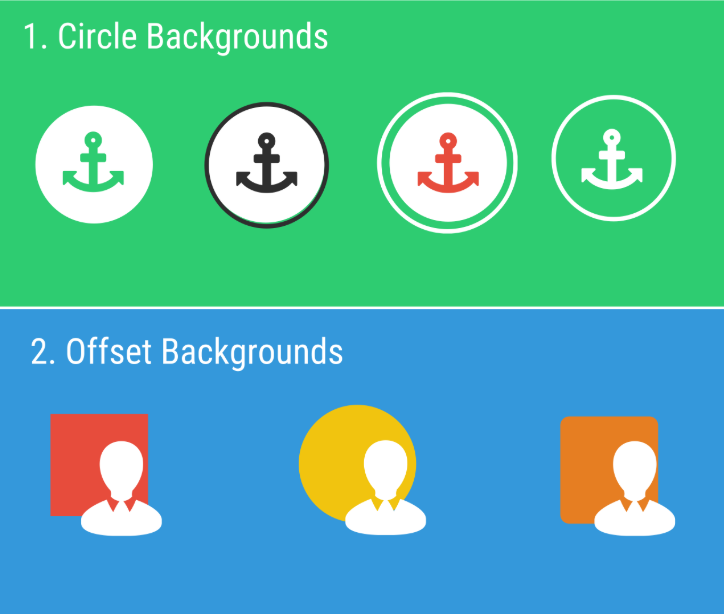
1. Use icons everywhere you can
Be it titles or names, graphs, and charts, lists and headers, backgrounds. This way, you will be able to save some space on the infographic, yet convey the main idea or message of the project.

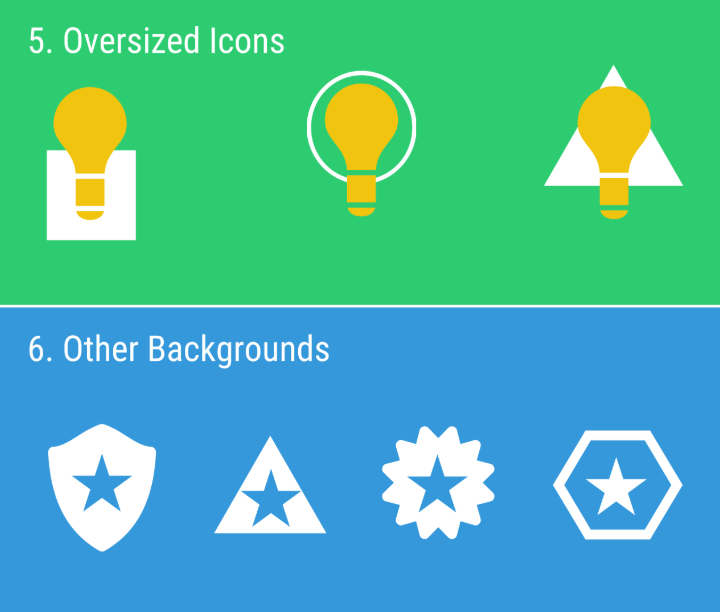
2. Mind the size of infographics icon
When applying icons to the graphic, you may want to make them bigger to be noticeable. Although, this is not the best option if you want to build eye-catching infographics. The icons shouldn’t overshadow the text or, otherwise, get lost in it. Too much negative space will point that you use too small icons, while too little white space will indicate that you go too large. In short, when sizing icons, make sure they are noticeable, yet not annoying.

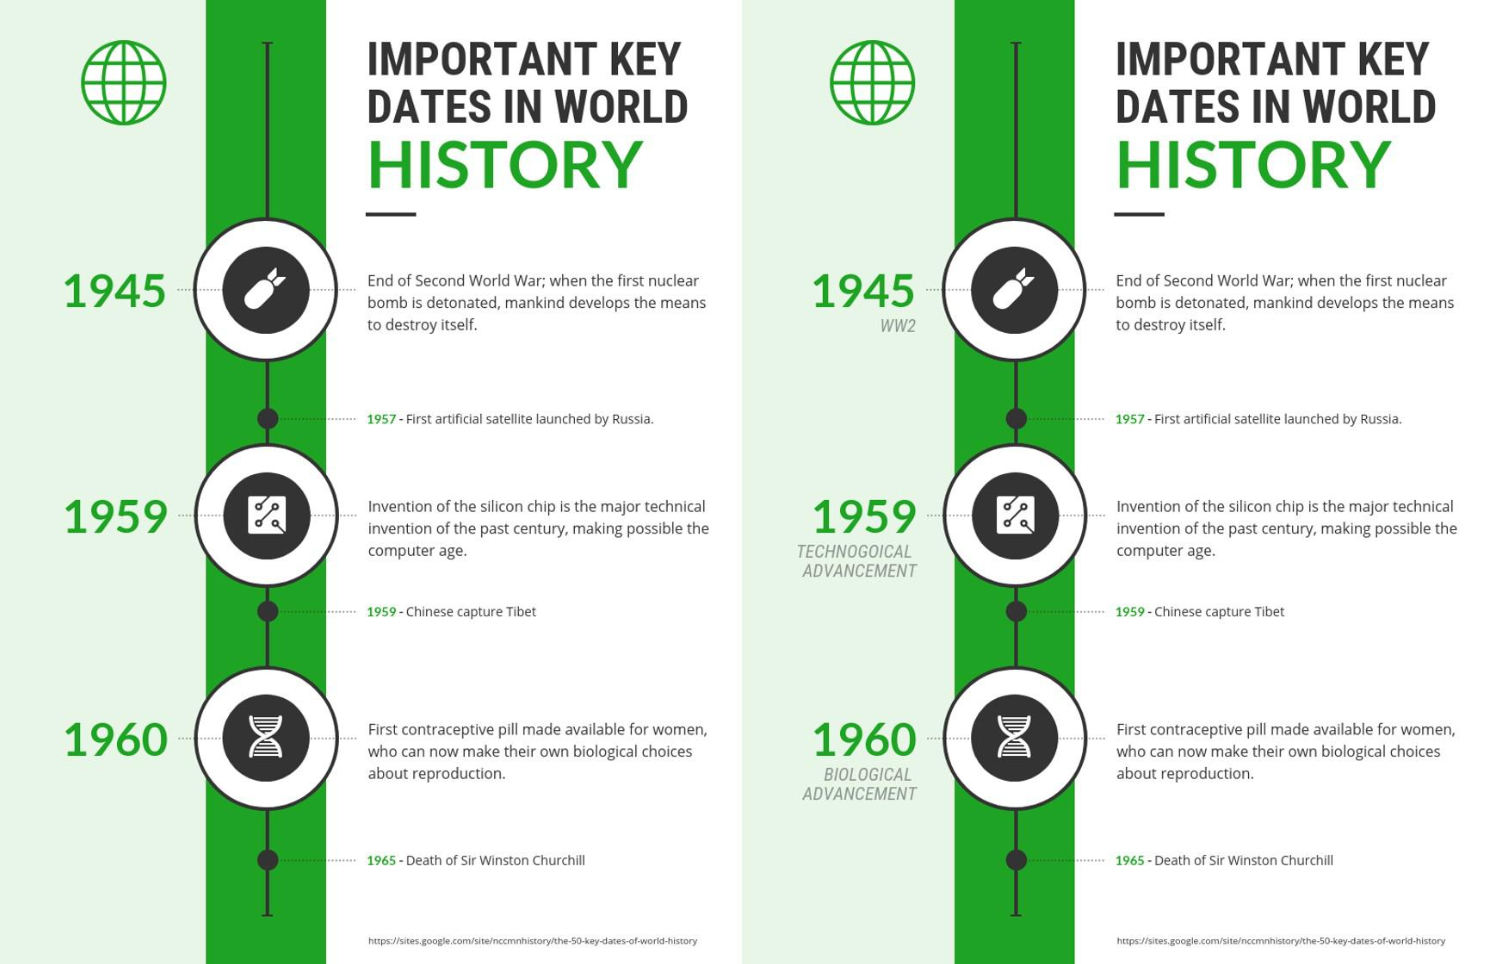
3. Consider using icon labels
After UX Myths, using a label next to the icon greatly improves visibility. And this statement refers to infographics as well. With the use of labels, icons can make the infographic more legible explaining the information you want to convey.

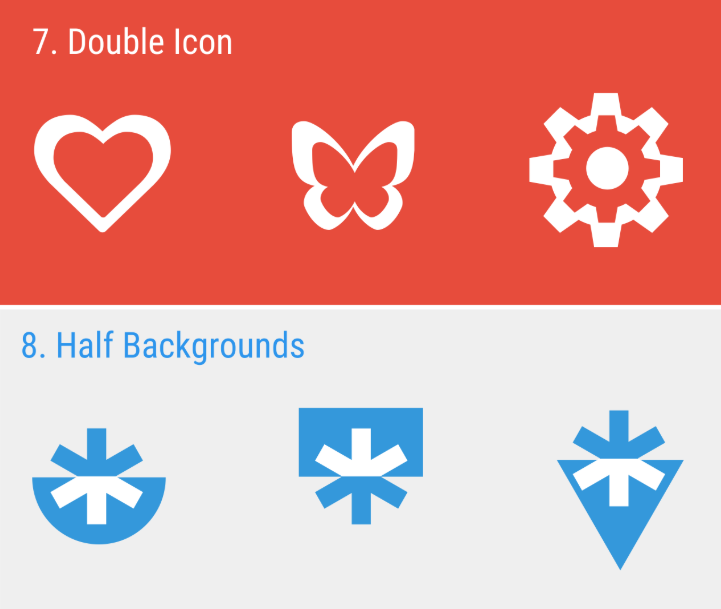
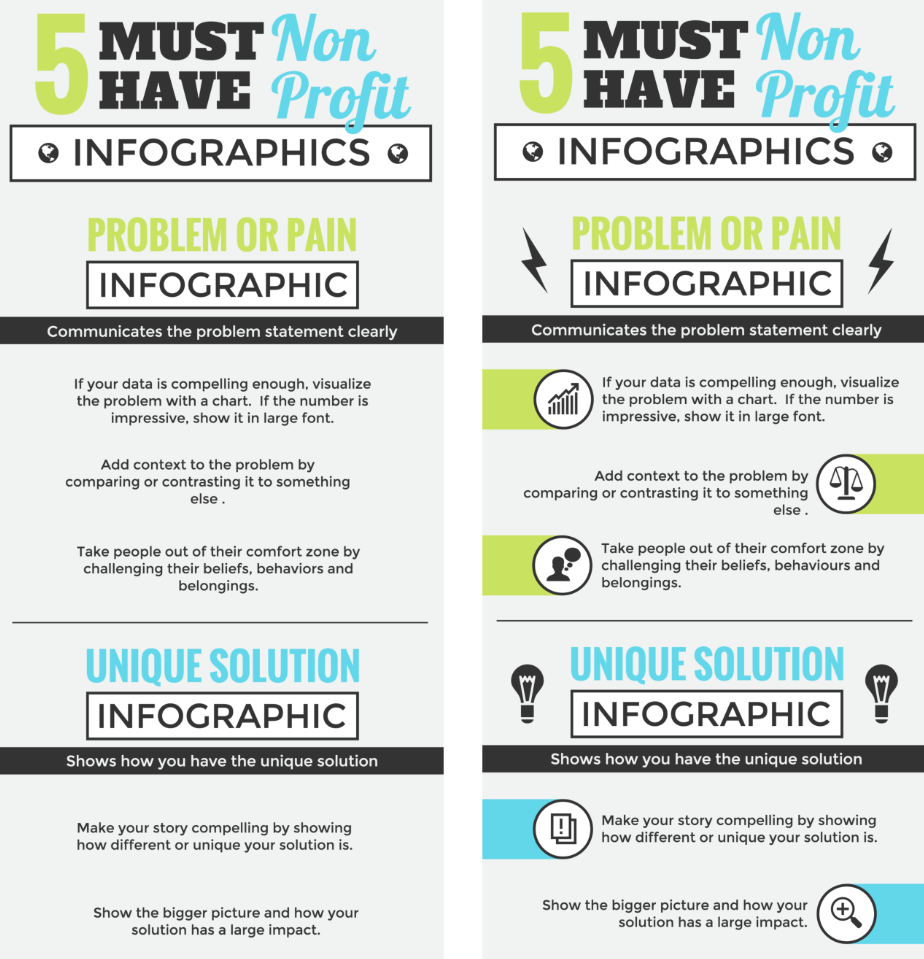
4. Use icons to arrange infographics space
If you want to break infographics into sections and highlight important details to flawlessly guide the audience through it, icons will come in handy. They are especially useful in terms of longer infographics with a lot of sections and comprehensive data. While acting like bullet points and paragraph breaks, icons allow readers to quickly grasp the information without spending much time.

5. Bring together icons and text
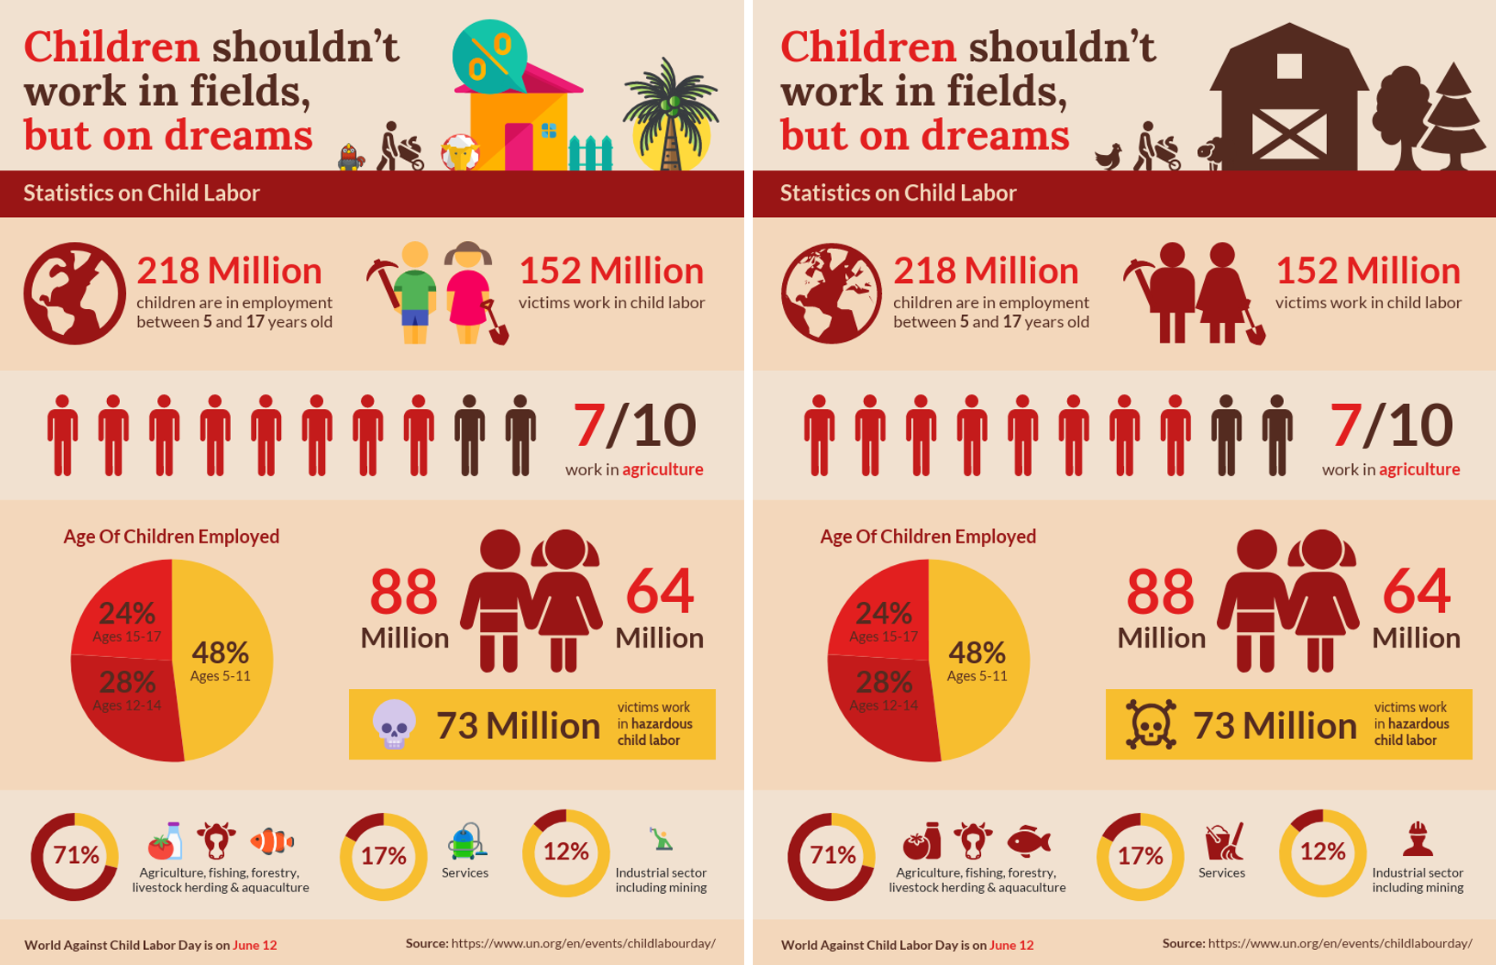
Labels are not the only element meant to be next to the icon. Another important thing you ought to pair icon with refers to the text. Don’t leave icons without content unless they are enough illustrative to let people understand the main idea.
Nevertheless, in many cases, like deep topics about poverty indicators, etc., icons cannot be left alone without content. Make sure that the infographic icons are consistent in style and appearance as well as relevant to the content they complement.

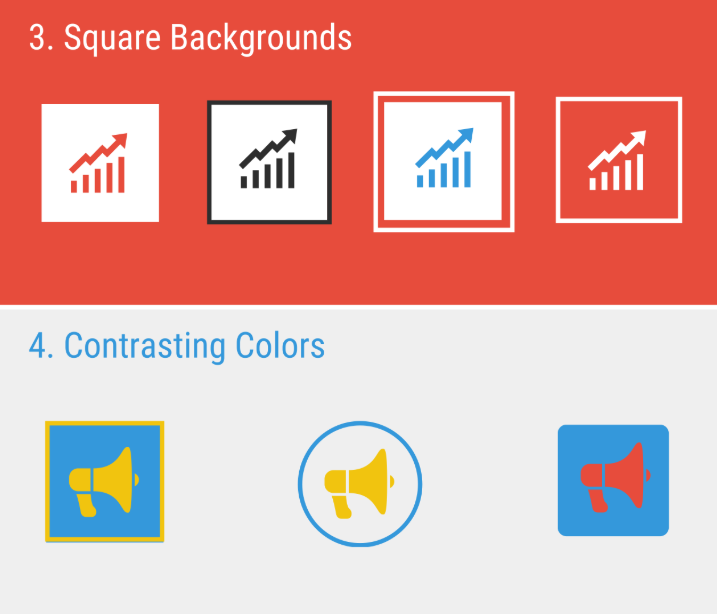
6. Pick a color wisely
Color can make your infographic eye-catching, but, like with icons and text, colors should be relevant to the content as well. Here are a few tips that will help you pick the right color for icons:
- Make certain that the selected color matches your brand and theme.
- Consider using the color wheel to pick the color. For that, make a plan. When selecting colors, pay attention to brand ones. Leverage tints, tones, and shades while playing around with the color wheel.
- Keep it consistent, of course.

Bonus: Infographic Elements Overview
The tips discussed earlier are more about the cases when the designer decides on creating an infographic from scratch. However, if you don’t want to spend much time on that, we are glad to offer you a list of pre-designed infographic templates.
As far as they come equipped with all the necessary elements, like icons and fonts, you don’t have to surf different sources in seeking them. All the elements are available in vector files which will make the editing process as easy as pie. You only need at least basic skills with Adobe Photoshop and Illustrator.
3D Vector Infographic Elements

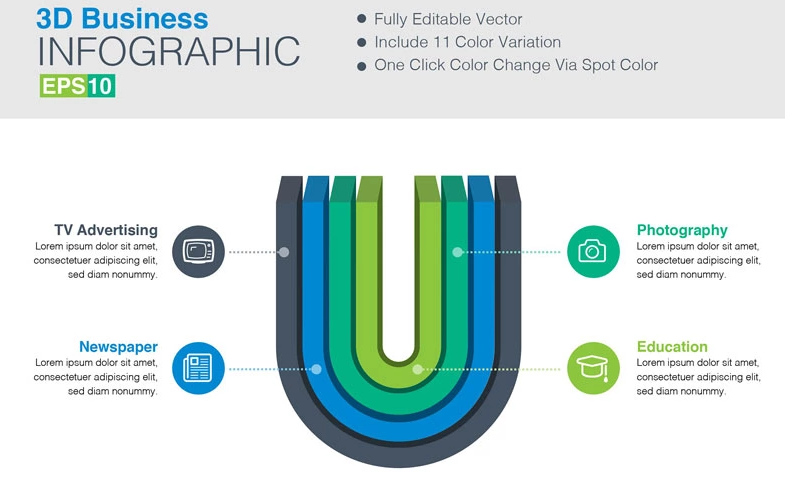
If you want to personalize your infographic, take a closer look at this pack of 3D vector elements. It is suitable for business projects, presentations, articles, business reports, emails, and other purposes. The set comes with 11 color variations which allow you to experiment with the infographic. When using spot color, you can change it at the push of a button. On top of that, all elements are available as vector files that will ease editing them in Adobe Illustrator.
Widely-Used Essential Infographic Mega Bundle

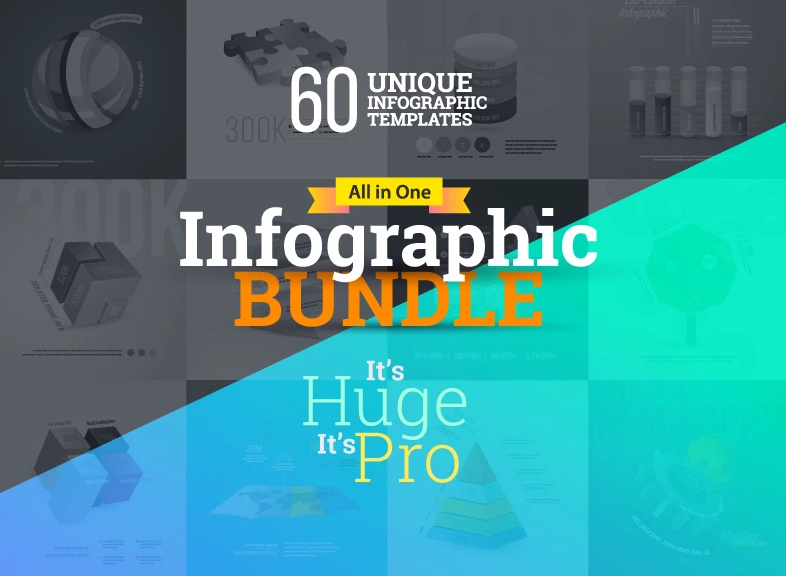
Meet this all-in-one infographic bundle for creating engaging and converting business infographics. Aside from 60 unique templates available in the pack, you will also get access to different styles including 3D, 2D, and flat one. That being said, you will be able to play around with the settings until you like the final result. All files are disposable in Ai, PDF, and Ps formats which will let you open and edit infographics in different software.
Hosting - Pricing Table Infographic Elements


Consider this pricing table infographic elements pack if you are looking for a ready-made product for your website domain hosting business. Developed following the latest web design trends, it comes with a clean layout and a well-structured interface. The set includes 4 packages with free fonts used and can be edited in Adobe Photoshop at the push of a button. Text, colors, and objects are all editable as well so that you can build an infographic that would sound uniquely yours.
3D Business Set-03 Infographic Elements


This is a widely-used infographic set best suited for business, personal, and commercial purposes. It contains the conceptual elements to help you build an outstanding infographic presentation. Inside the package, you will also find 15 unique templates that can be used individually. They all are well-organized, high-quality, and fully editable, so you don’t have to spend eternity to apply some changes to them.
3D Infographic Elements


Have a look at this powerful vector template that comprises a bundle of 30 custom-designed graphic elements in blue and green colors. It is a perfect solution for everyone who wants to spice up websites, presentations, business reports, promotions, and other marketing events. The elements are available in vector and raster formats which makes them easily accessible from different design software. As a pleasant bonus, you’ll also get animated GIF icons available right out of the box.
Creative Education Infographic Elements


This is a collection of infographic elements for educational purposes. Designed in 300 dpi resolution the elements are all easy to edit and customize, as well as ready to print. So, if you need to provide the audience with the copies of your infographic presentation, this certain template will come in handy. On top of that, the elements come with the CMYK color model which is perfect for color printing.
Infographic Elements Volume 1

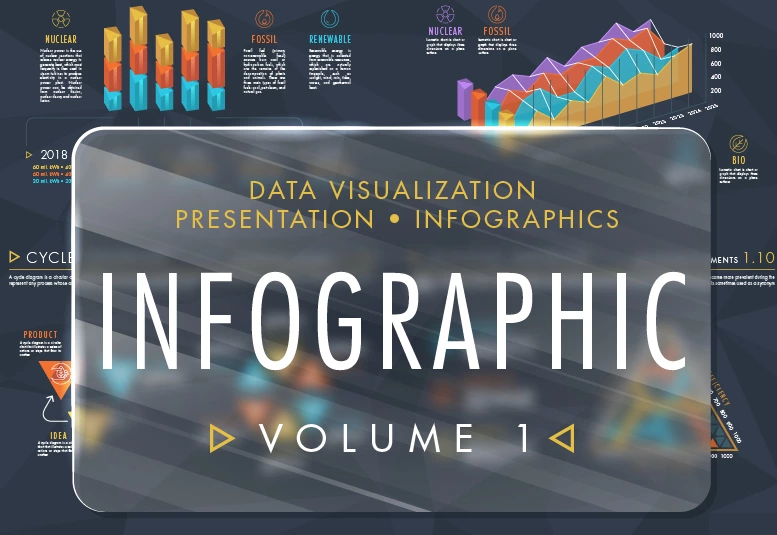
Consider this bundle of pre-designed vector elements that will perfectly work for data visualization, presentation, custom-made infographics, business reports, marketing, and websites. Creating data visualization may cost you an arm and a leg as well as taking much time and effort. Although, using pre-made elements included in the bundle will save you the hassle of creating an infographic from scratch. Colors, text, fonts, stroke weight, and transparency are all editable, so you need only basic skills with design software to start building an infographic shortly.
Read Also
Everything You Want to Know about Comparison Infographic
Business Infographic — Making Hard Things Easy
Find Your Perfect Infographic PowerPoint Template
Infographic Templates: Instead of Splashing a Thousand Words