Business Infographic — Making Hard Things Easy
- What are Infographics?
- What Makes Effective Infographics? Tips to Save the Infographic from Disaster
- Business Infographic Types — Best Infographic Ideas for Your Project
- Business Infographic Templates: Quick Overview
As far as 65% of people from the whole world are visual learners, using visual elements in your content is a perfect solution to boost the audience’s interest and keep engaged. Infographic elements allow you to deliver the business ideas an easy way to let the audience clearly understand the message you want to convey.
Although infographics bring a lot of benefits, the misconception still exists and many businesses try to stay away from this content format finding it not professional to leverage in serious affairs. In fact, an infographic is not just fonts and icons. So, our goal is to prove the effectiveness of well-structured infographics and the importance of its use for business.
If you still believe that this content format is unprofessional, stay tuned and get ready to change your mind.
What are Infographics?
But before we convince the effectiveness of infographics, let’s learn its definition. As stated by Wikipedia:
"Infographics are “graphic visual representations of information, data, or knowledge intended to present information quickly and clearly. They can improve cognition by utilizing graphics to enhance the human visual system's ability to see patterns and trends”. In other words, this is a form of visual communication aimed to draw attention and enhance comprehension. These days, you can come across infographics online, in magazines, and even on the wall of your family doctor’s office."
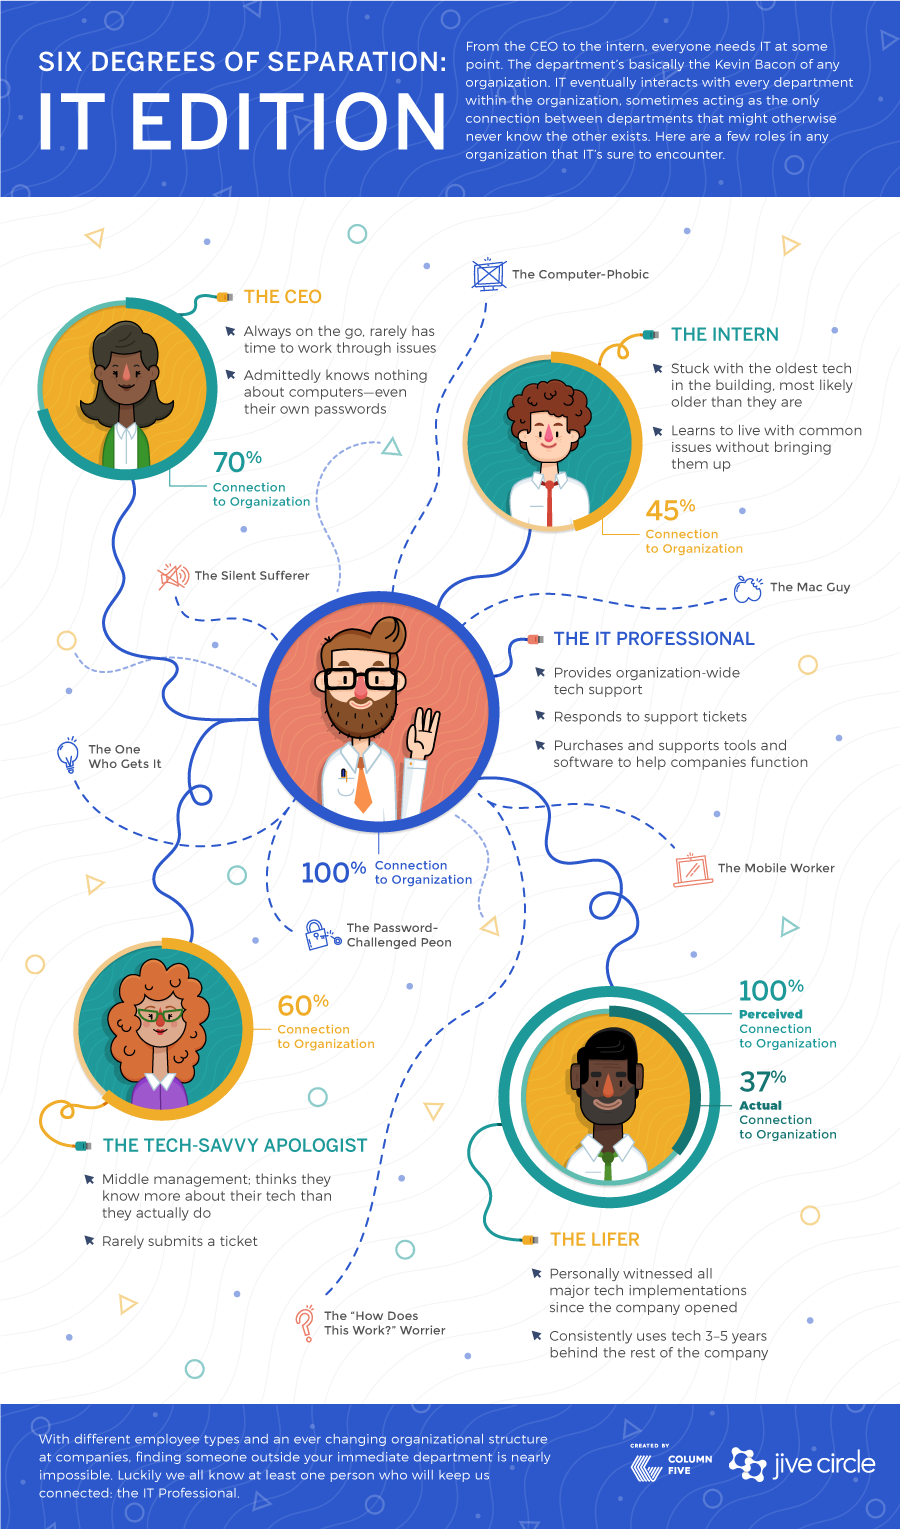
Source: columnfivemedia.com
Defining infographics is not yet good enough to start creating one. Before that, consider the best infographic size and dimensions for various sources. So, you’ll get an idea about what size is perfect for Facebook, Twitter, Instagram, and other social networks.
Standard Infographic Size and Dimensions
Within this quick guide, you will be able to figure out how certain infographic dimensions can boost engagement and ensure legibility. Make sure to bookmark this paper to have the accurate infographic size at hand when it comes to building it for the next business project.
| Source | Dimensions | Quick Notes |
| Standard blog posts | 663 x 2000 pixels | This is a standard recommendation. To know what works best for a blog post placement, make sure to play around with a size |
| 1200 x 628 pixels for shared post image
1.080 x 1.920 pixels (aspect ratio of 1.91:1) for Facebook Stories |
Take into account the suggested range from 403 x 403 pixels up to 2048 x 2048 pixels | |
| 1.200 x 675 pixels (aspect ratio of 16:9) for a single image or gif
1.200 x 675 pixels for a part of multiple images |
No comments | |
| 1.080 x 1.080 pixels for a square image
1.080 x 566pixels for a horizontal image 1.080 x 1.350pixels for a vertical image 1.080 x 1.920pixels for Instagram Stories |
No comments | |
| 600 x 900 pixels | When adding an infographic to Pinterest, watch the length of the pin to avoid cutting off. Because the pins are arranged into columns, vertical pins take more space and, consequently, stand out more | |
| 1.104 x 736 pixels for the shared image | No comments | |
| Snapchat | 1.080 x 1.920 pixels | No comments |
| Printouts | 8.5 x 11 inches for letters
8.5 x 14 inches for legal 7 x 10 inches for executive 11 x 17 inches for tabloid 4 x 6 inches for photos 8.3 x 11.7 inches for A4 paper sheet 11.7 x 16.5 inches for A3 paper sheet |
These dimensions are worth paying attention if you plan to print out the infographic for a flyer, poster, or resume |
What Makes Effective Infographics? Tips to Save the Infographic from Disaster
The power of visual content is usually underestimated. Not only can infographic tells the story of your project attractively, but it also allows businesses to gain 12% more traffic compared to those not using the infographic in marketing. But what makes it effective? Let’s see.
- The targeted group of people. Make sure to research the target audience, its pains and gains, preferences, etc. to create the infographic in which the audience will find solutions.
- The theme that correlates with your brand. Set the theme of every single infographic within the main direction of your business which matches the brand as well.
- Precise text content. Use powerful headlines to communicate the business idea and make people share it.
- Relevant data. Find accurate information for the infographic and add the statistics that would prove that your product or service can solve the audience’s problem.
- Stunning graphics. As far as infographics refer to visual content, it is obvious that the graphic you use should be appealing. Keep it simple and flowing, tell the story in sections, use colors moderately, make sure it is legible, don’t repeat things.

Source: neilpatel.com - Manageable dimensions. Don’t go too big. The longer the infographic, the more potential clients you can lose. Go no longer than 8.000 pixels and no more than 1.5Mb in size.
- White space. Keep balance using visual elements for the infographic and leaving enough negative space to guide the audience.
- References. While building an infographic, make sure to cite the sources you get the data from. References should be as up to date as possible.
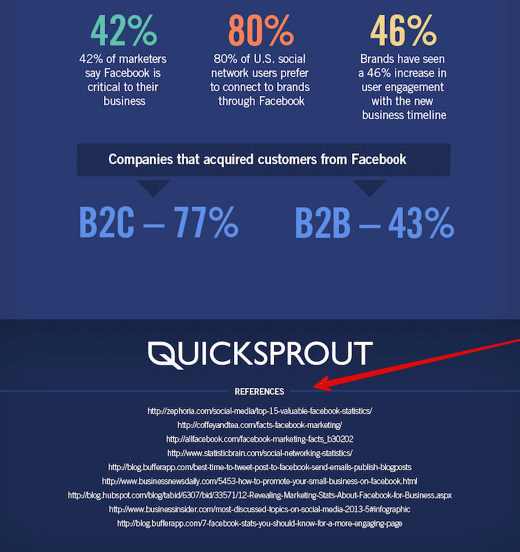
Source: neilpatel.com
Power of numbers
Once you are finished with the infographic set up keeping in mind all the above-mentioned tips, it’s high time to promote it on your social media websites and get it featured on the partners’ blogs.
It’s difficult to overestimate the power of numbers. That’s why statistics is convincing support to the arguments you present to the target audience. One the one hand, numbers are usually a good point to encourage people to do something. However, sometimes it’s difficult to comprehend a lot of mathematical information especially if readers see them in the blog posts. So, it’s better to use statistics in the infographics. It will be easier to show the important figures and keep people interested in the facts you want them to know.
There is a good example that shows how to add the statistics to your blog posts or articles and do it properly. First of all, you will see how to use statistics in the infographics. What is more, you will find out information about some current trends in blogging statistics. It's important to think not only about the numbers you want to show to your readers. It's worth paying attention to general blogging statistics. It helps you understand whether you hit the target or your writing needs improving.
As for the essential statistics, there is useful information about the number of bloggers and their reasons for blogging. You will get to know why people read blog posts and what they are looking for in most cases. To write an effective blog post, it’s important to know when to publish the new posts. The length of the blog posts also matters. As it’s stated in the article, post length, headlines, and types of content you offer to people have a direct impact on sharing the posts.
Moreover, you will learn how much time it’s recommended to work on your blog to make it profitable. For instance, 6 articles or blog posts a week are a good result that will bring you a sufficient number of leads. The frequency of publishing is also important. As statistics shows, bloggers who post once a day have better results than even those who do it several times a day.
Thus, knowing this general blogging statistics may help you decide whether you are on the right track or not. If not, the facts offer the way to improvement.
Besides the general statistics, there are samples of infographics with numbers concerning the types of content that readers prefer. According to the research, visual images are the most commonly used content. The authors also show the results of the survey about using images in the blog posts. Photos of real people vs stock photos: what will have more effect on conversion?
Furthermore, there are infographics with data about driving traffic to the blog. There are statistics about keyword search and the most popular sources of traffic. As the numbers prove, the main amount of traffic in 2019 comes from social media. The search engine optimization takes the second place. The final thoughts and statistics in the article refer to the advantages of blogging.
Thus, the numbers presented in the infographics clearly illustrate the importance of considering statistics not only for blogging but any activity.
Why Infographic is Essential for Your Business?
We’ve already mentioned that infographics can bring a lot of advantages to commerce by letting you communicate the essential data to your potential clients with ease. But still, this is not the only favor. Here are a few more ways the infographic can benefit the business.
- Infographics keep the audience engaged. When you have a long read posted on the blog, infographics allow taking a break from the text. This content format boosts the audience’s interest and makes them engage.
- Infographics make the data easy to digest. Instead of communicating the information in the entire paragraph full of useful facts, convey it within the infographic. This way, you’ll prevent the audience from missing out on the valuable data, hence expand conversions.
- Infographics allow demonstrating your competence. To provide the audience with the statistics on your field, you first need to spend much time on researching. Showcasing that you are an expert in the subject allows let you build trust with the audience. Since you know what you are talking about, they are more likely to go with your business.
- Infographics let you increase brand awareness. It reflects the brand and style of the company, hence give the client a clear understanding of what you are offering. Infographics close the gap between the brand and people concerned with your business.
Business Infographic Types — Best Infographic Ideas for Your Project
Today, infographics are more versatile than ever before. You can tell the story differently, but the most common design formats include static, animated, and interactive infographics. Every single format has its unique benefits, so while opting for the most suitable, consider the story you want to tell and platform to use for telling that story.
Aside from design formats, there are also different types of business infographics. The experts find about ten types, but the following ones are more common for business and marketing.
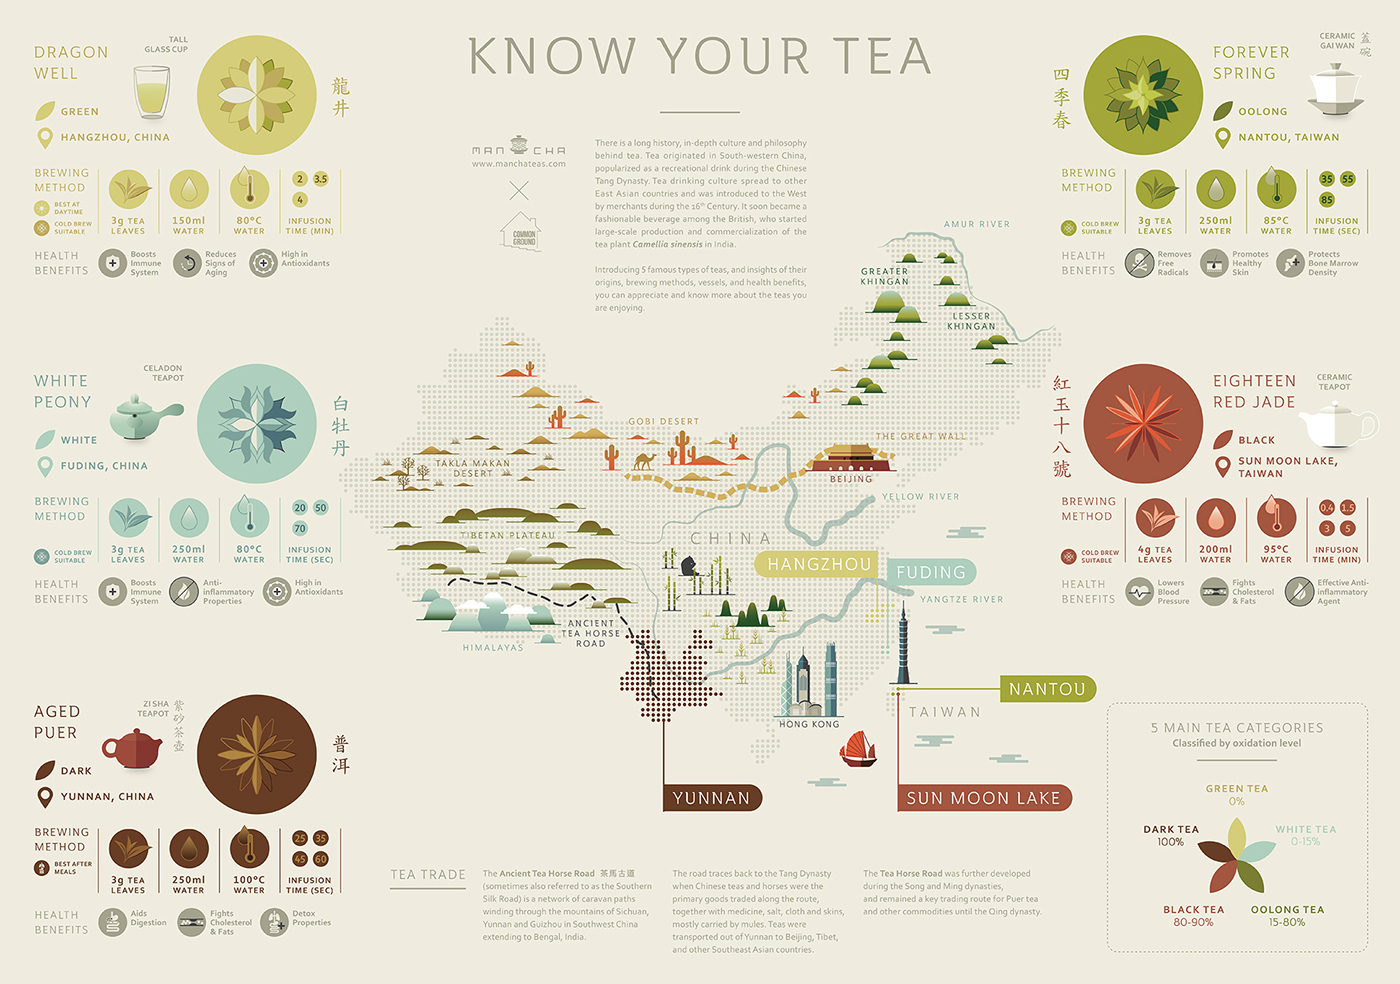
- Map infographics to provide data based on location during business activities and annual reports.

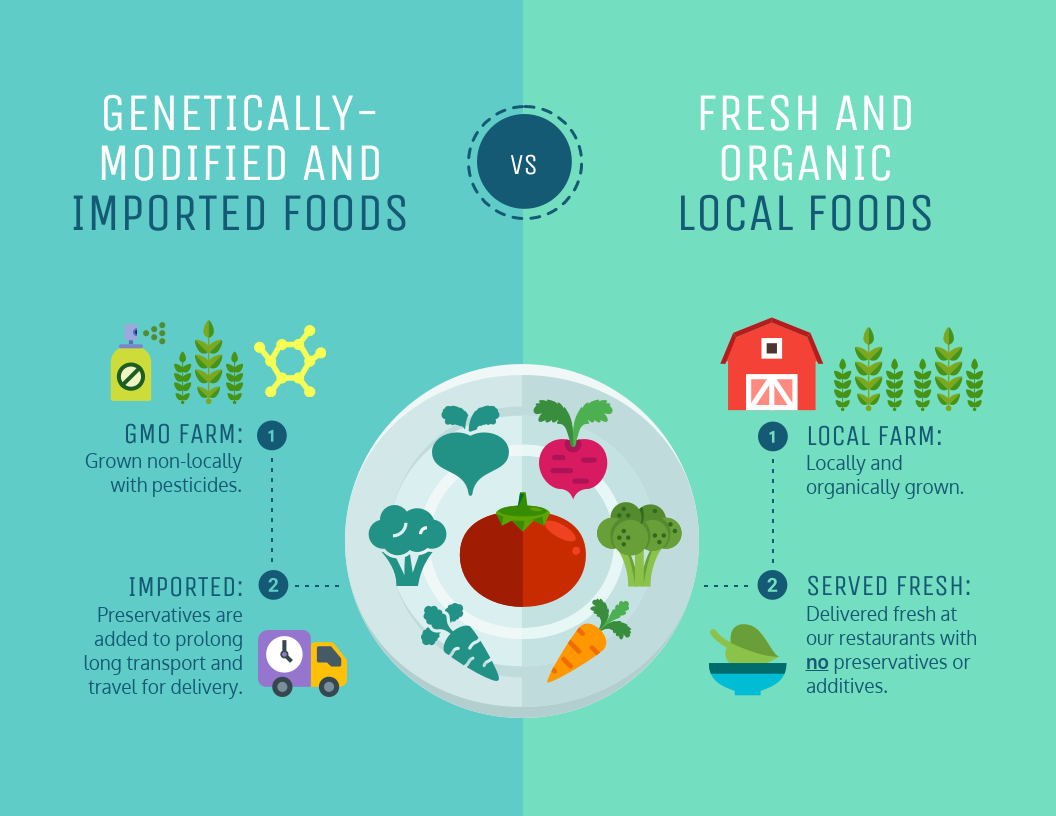
Source: Behance - Comparison infographics to compare ideas, concepts, or objects to your clients.

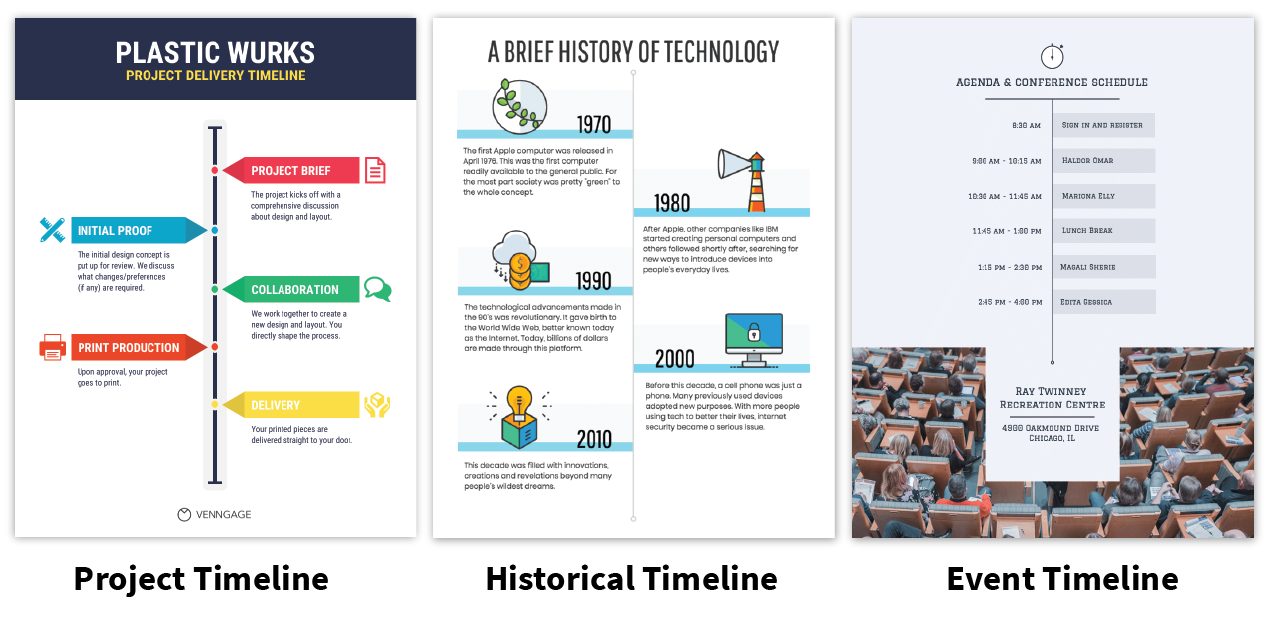
- Timeline infographic to make a long story short and display the logical relationship between things.

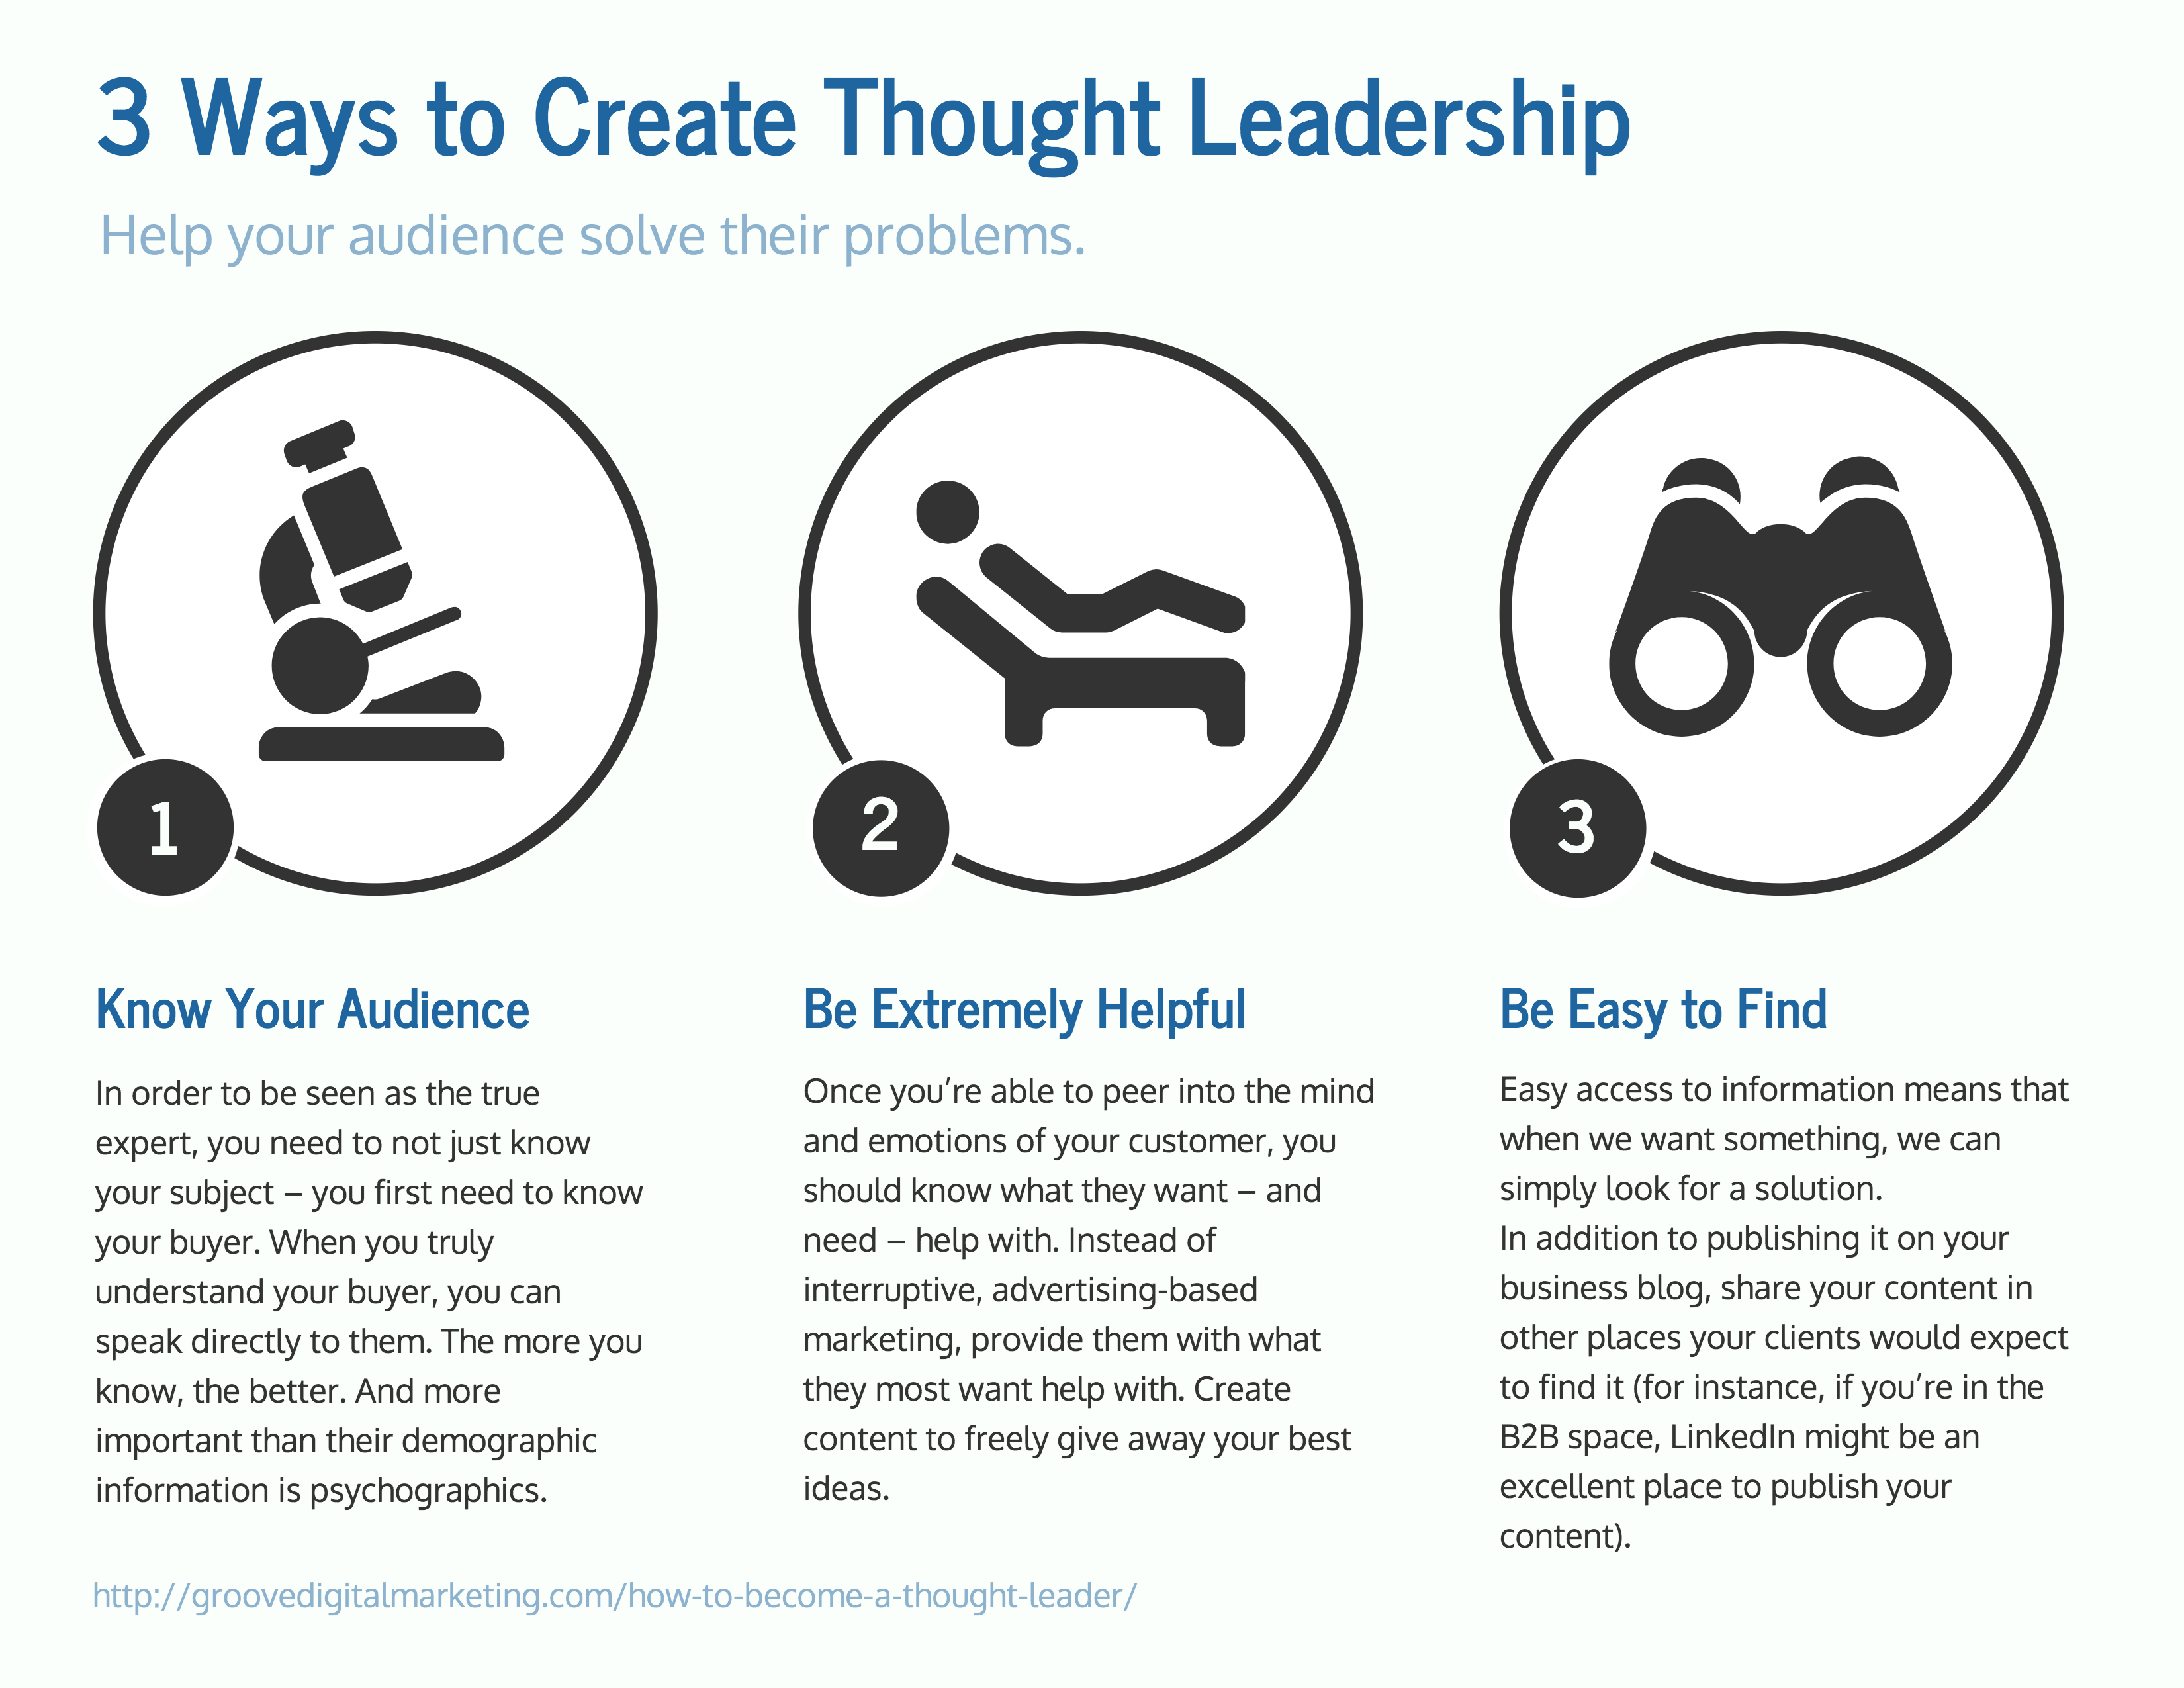
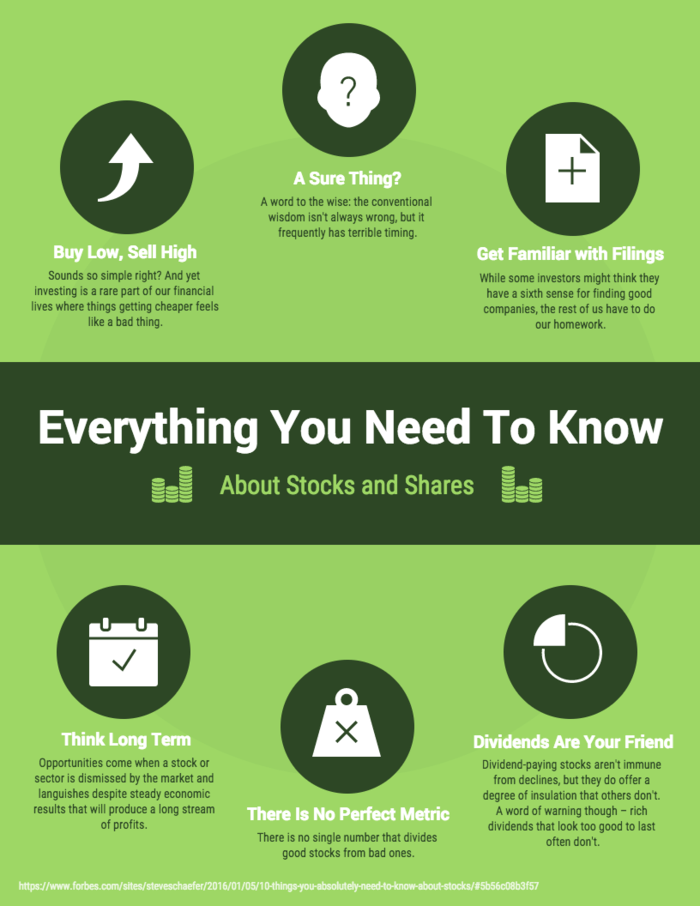
- List infographics to support certain claims, facts, or arguments.

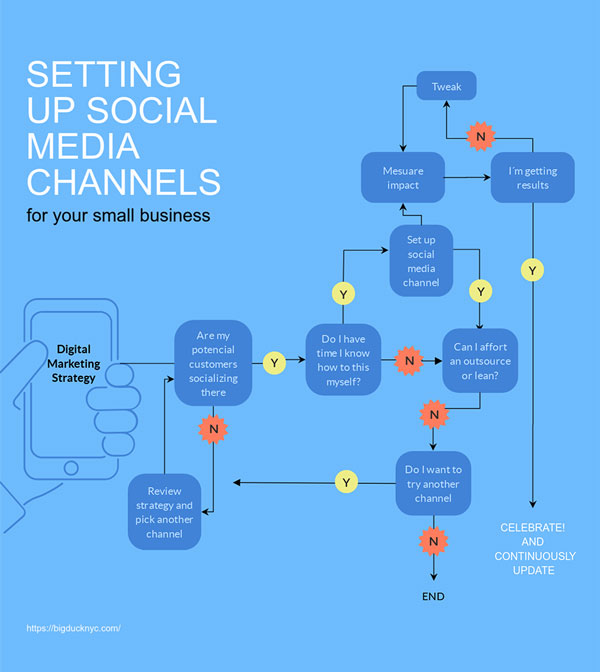
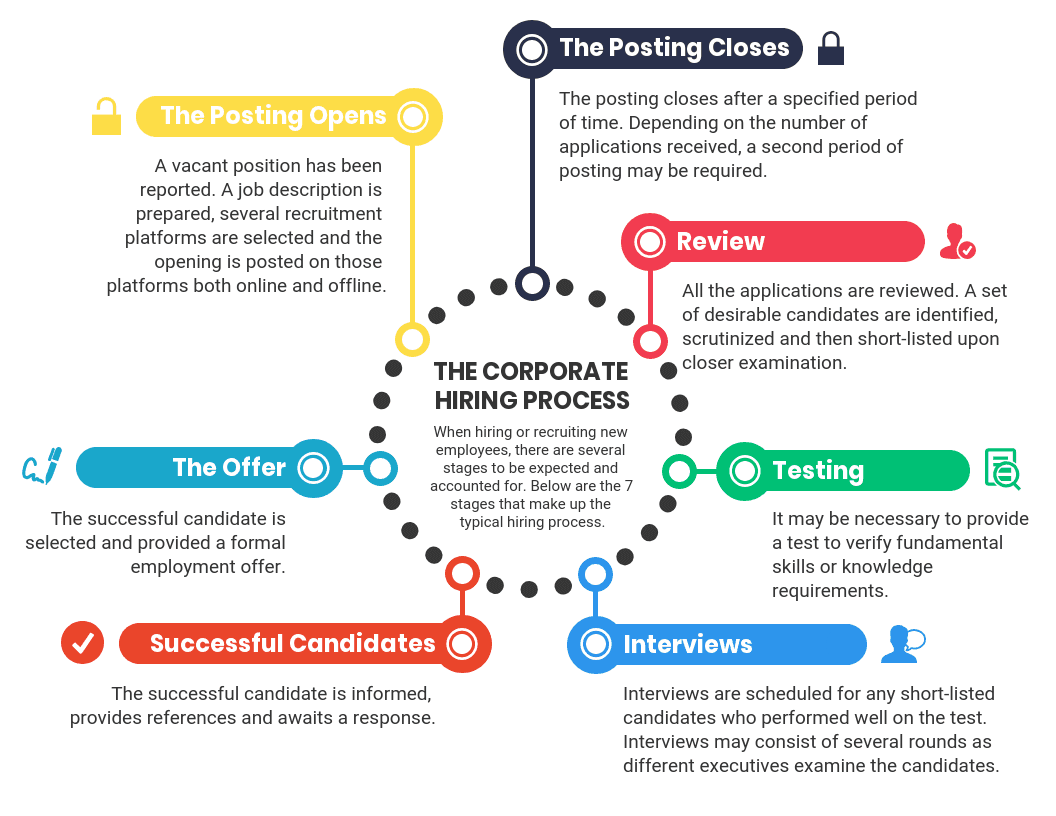
- Flowchart infographic to explain how to reach similar or various outcomes in multiple cases.

- Instructional infographics to cut the lines of the article and make it more engaging.

- Process or How-to Infographic to explain complex ideas in an easily-digestible way.
Business Infographic Templates: Quick Overview
Now that you know a lot about the infographic, the types it comes in, and the ways it benefits the business, it’s high time to start creating your own. For everyone who doesn’t want building an infographic to make a hole in the pocket, ready-made templates will help. Equipped with all the necessary elements all in one place, they will greatly save the time. Consider the following templates to choose the one that would perfectly suit your business needs.
Infographic Bundle | 900+ Vector Infographic Elements

This is one of the biggest collections of infographic elements aimed to help you convey the business idea easier way. It works well for PPT presentation, annual report, business analysis, marketing, promotional email, and more. The template includes over 150 3D business infographics elements along with four handmade color schemes and other features like:
- Arrow infographic elements pack.
- Timeline infographic.
- Pyramid infographic.
- Tree infographics set.
- Map infographic and more.
Search Engine Optimization Infographic Elements

For those of you who don’t want to spend much time and money on building an infographic, this SEO elements pack will come in handy. By using it, you can make the infographic vivid and classy. Because the elements are easy to edit and customize, you have an opportunity to add a personal touch to them and make the presentation recognizable. An extensive feature set will also help you experiment with the look of the infographic.
- Theme color switcher.
- SEO vs PPC infographics pack.
- Site architecture and structure infographic.
- Content marketing and linking elements.
- Compatibility with Adobe Illustrator, etc.
Social Media and Marketing Vector Elements Pack Infographic Elements

With pre-designed infographic templates, you can save time and money. You don’t have to hire a developer to create an infographic from scratch. Now, you have a chance to build it independently using all the needed elements included in the template and edit them in Adobe Illustrator shortly. Aside from 4 color variations for all infographic elements, you will also get:
- Social media cloud template.
- SEO optimization infographics set.
- Tree infographic.
- Theme color switcher and more.
3D Vector Arrow Infographic Elements
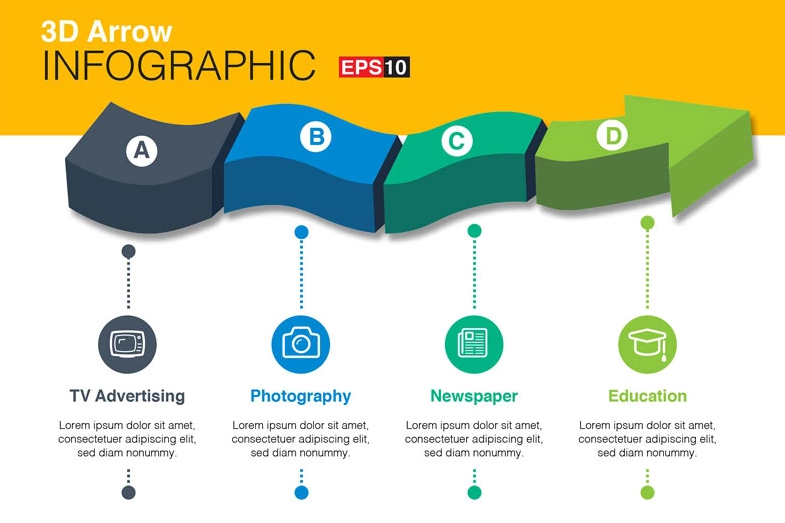
Consider this arrow pack if you want to build a unique and outstanding infographic for PowerPoint presentation, brochure, portfolio, or other reports. It comes with three different color variations which will let you play around with the style. A few more features available with this template include:
- Compatibility with Adobe Illustrator.
- 100% editable vector files.
- 1-click color changes through spot color.
- Theme color switcher.
- Long-term support, etc.
Amazing Big Bundle Infographic Elements
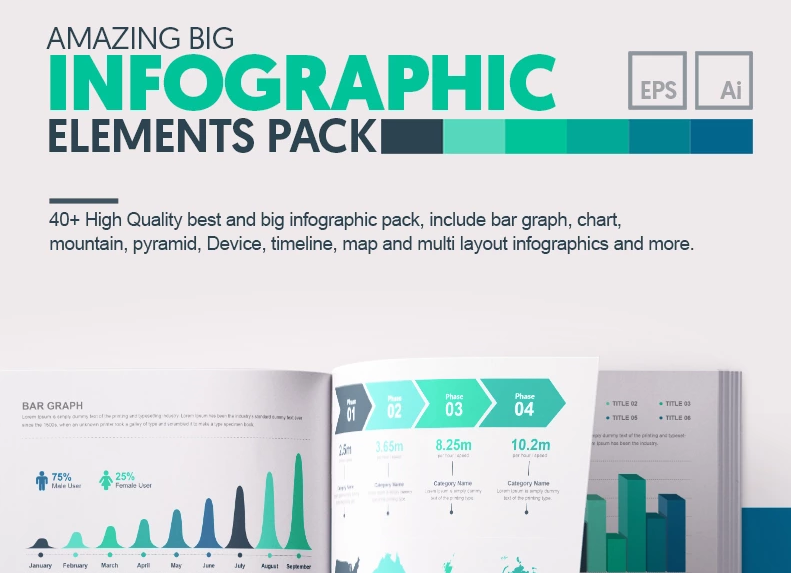
Ready-made infographics set is a perfect solution for everyone who wants to build infographics fast and easy without spending a fortune. If you are on a low budget, give this big pack a try. Use it for your upcoming PowerPoint presentation, annual report, business analysis, advertising, promotional emails, and other purposes. Apply minor changes to the infographic using Adobe Illustrator and a great number of features like:
- 40+ popular infographics elements.
- A variety of charts, graphs, icons, and other custom shapes.
- 8 color schemes.
- Download links to free fonts used in the pack.
- AI CS5 and EPS CS5 vector files.
The Biggest Bundle of Vector Infographic Elements

Have a look at another extensive bundle of vector infographic elements if you are looking for the best solution for your upcoming business presentation or report. Feel free to use this template for different purposes comprising brochure design, resume, marketing, etc. Inside the package, you will find over 60 infographic elements, 5 color schemes, and other features that will help you build an infographic with ease.
- Compatibility with Adobe Illustrator only.
- Timeline infographics set.
- Pyramid infographic templates.
- Arrow elements.
- Tree and map infographics pack.
3D Business Bundle Handmade Realistic Infographic Set
This is a handmade realistic infographic set specifically designed for the best PowerPoint presentations, annual reports, business analysis, and others. With 3D elements, you will be able to impress the audience, hence boost their interest and keep engaged. Editing template is not that difficult — all you need is Adobe Illustrator and little technical knowledge. As far as the infographic bundle comes equipped with the necessary tools, the editing process will be a piece of cake.
- Over 30 high-quality infographic elements.
- Bar graphs, charts, mountains, timeline, and map sets on board.
- Multi-layout infographics.
- AI CS5 and EPS CS5 vector files included in infographic bundles.
- 5 color schemes, etc.
Tree Bundle — Infographic Elements

If you prefer to use tree infographics style within the annual reports or business presentations, this specific pack will greatly work for you. Hiring a freelancer and spending a fortune on making infographics from scratch is not necessary any longer. All you need to create this content format by yourself is available in one place. With built-in tools, you can edit and customize infographics at the push of a button.
- 4 color variations to choose from.
- Theme color switcher.
- 35+ beautiful vector elements and templates.
- Compatibility with Adobe Illustrator.
- 10 popular tree infographic elements.
Read Also
How to Make an Infographic with Google Slides Using a Template
Find Your Perfect Infographic PowerPoint Template
Infographic Templates: Instead of Splashing a Thousand Words

Self-taught copywriter specialized in web design, marketing, and traveling. Graduated with a degree in German and English translation. Obsessed with guides, listings, and long-read blog posts. Open for new information and strives to explore more undisclosed subjects. Social Media Accounts: Fb, Twitter, LinkedIn.
Get more to your email
Subscribe to our newsletter and access exclusive content and offers available only to MonsterPost subscribers.

Leave a Reply
You must be logged in to post a comment.