Coffee Infographic: Best Tips, Inspirational Facts, and Insights
- Everything to know about coffee
- A brief history of coffee
- What is an infographic?
- Tips to create a remarkable coffee infographic
- What makes a good infographic?
- Don’ts of infographic design
- Coffee infographic templates inspiration
- Final word
Coffee lovers are everywhere. Every day one can see a person with a cup of coffee on the street or in a cozy cafe. In the morning, most of us find ourselves in need of coffee, so aromatic and tasty. The magic of coffee has penetrated not only cafes and streets but also the features of interior design, web design, fine arts, illustrations, décor, etc.

Today we'll talk about coffee and coffee representation on the web, namely coffee infographics. You'll learn some interesting facts about coffee, its history, plenty of information about infographics, infographic tips, dos and don'ts of infographic design, and many other interesting facts. So, grab a cup of delicious coffee and read this article about this incredible drink and its representation in infographics.
Everything to know about coffee
If you want to know all about coffee and a bit more, here are some curious stories about the drink.
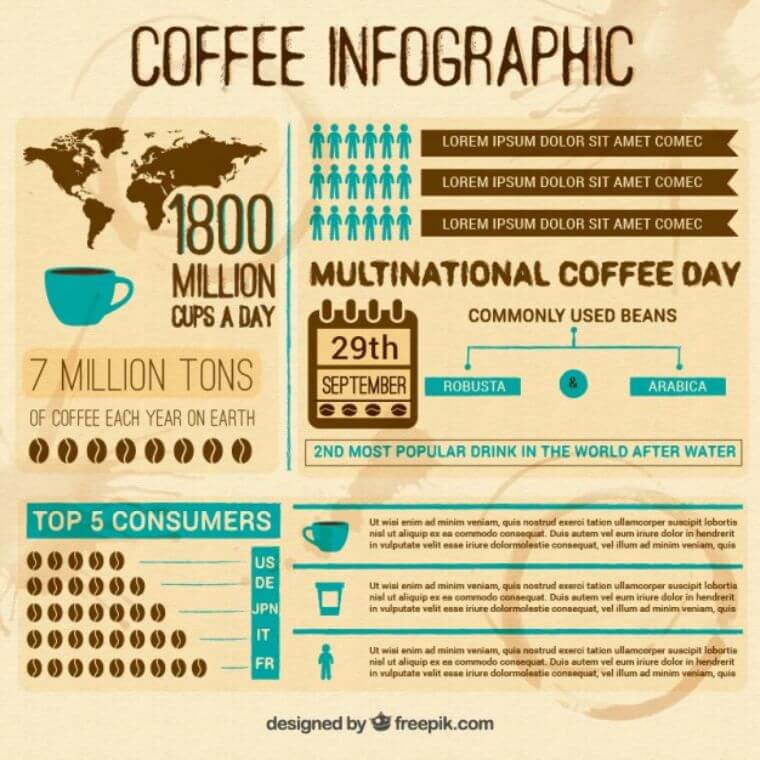
- There are two main types of coffee, Arabica, and Robusta. They have different coffee flavors. The former one has a milder taste and is more popular, and the latter one is more bitter and has a larger amount of caffeine. For a morning cup of coffee, it is better to mix these two types to get a rich but mild taste with a good portion of energizing caffeine.
- Coffee beans are not beans – they are seeds of the berries on the flowering shrubs. However, people always use the word “beans” due to the seeds’ physical similarity to legumes.
- Coffee berries can also be eaten and used to produce a wine-like drink.
- Espresso is translated as “pressed out” from Italian, which explains the method in which the coffee is prepared: during the process of boiling, water goes through the pressed coffee.
- If you are interested in where coffee is grown, here are some facts. As the International Coffee Organization (ICO) reports, the country that produces the largest amount of coffee, namely the third part of the coffee supply, is Brazil. Vietnam takes second place.
- The most expensive type of coffee is kopi luwak and is actually produced by animals called Asian palm civets. They eat coffee beans but being unable to digest them, the creatures excrete the beans with their waste. The coffee produced in this way has a less sour and smoother taste.
- If you wonder whether this drink brings harm or benefits to your health, here are a couple of ideas. To have a coffee overdose, you'll need to drink no less than thirty cups of this drink in a short period of time. The drink reduces the risk of liver disease and types II diabetes. What is more, a body scrub that contains ground coffee seeds and other beauty products containing this ingredient gives you silky skin and improves blood circulation.
- Most coffee addicts live in Finland and consume around 27.5 pounds of the drink annually as BBC reports.
- An average cup of coffee contains 95 – 200 milligrams of caffeine, while decaf has just 2-12 milligrams. Besides that, a cup of black coffee has only a few calories, but adding sugar, cream, milk, and syrups can make it jump to about 600 calories.
- Did you know: One of the leaders among coffee shops, Starbucks, opens 1-2 stores daily.
Overall, everything you need to know about coffee cannot be expressed just in writing. You should try the various tastes and recipes to know your coffee preferences.
A brief history of coffee
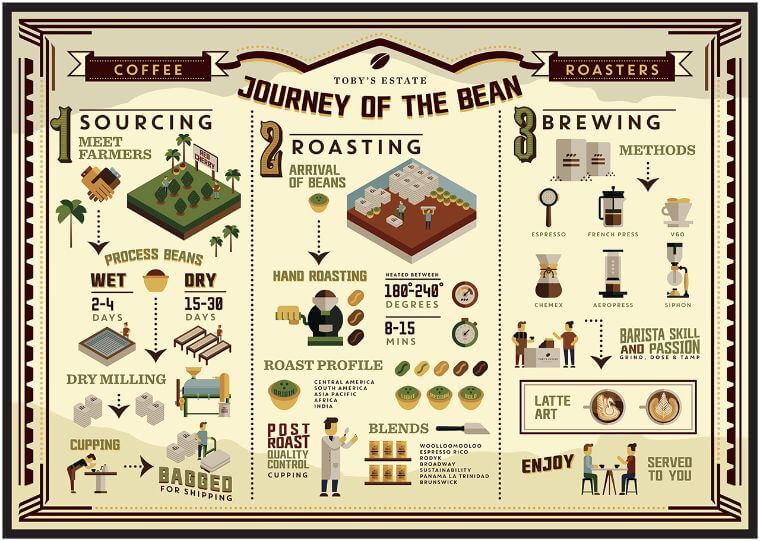
There is no single and clear data regarding when and how coffee was discovered, but there are numerous legends telling us about its origin. The primary popularity of coffee appeared with Muslim regions from the Middle East and Africa, in approximately the 14th century. In Yemen, coffee was prepared by gathering the coffee plant and boiling it. Further, a new method of drinking coffee was invented in Turkey, and we also know it as Turkish coffee; the beans are roasted over the fire and cooked slowly with water. Due to the impact of travelers and merchants who passed through Turkey, the coffee drink soon spread to European countries and then eventually to the entire world. Now, we know various types of coffee preparation such as using a filter, vacuum brewing, percolating, electric drip, espresso machine, aeropress, and maybe some other less common methods.
In the modern world, coffee designs appear in various details of décor, web design, fine arts, and different types of visual content. We'll talk about infographics, namely coffee infographics.
What is an infographic?
It is a simple tool to represent your information graphically. It appeared about ten years ago but is now widely used in education, work, and on the web. An infographic is usually a collection of imagery, charts, and text, and it provides a visual rather than textual description of data. You can utilize stock infographics for your project and a number of effective infographics templates can be found on TemplateMonster.
Tips to create a remarkable coffee infographic
In fact, making infographics is simpler than one might imagine. If you wish to design visual data representation about coffee, you may include such pieces of information as coffee drinks chart, coffee type infographic, where is coffee grown, different coffees, different coffee drinks explained, and so on.
There are several infographic tips for making a visually appealing coffee infographic. The first vital step of the project is the definition of the audience for your coffee infographic. It is highly recommended to identify who the viewers of this presentation will be, whether they are the visitors to a coffee shop, students or employees, or maybe your friends. It means that you should know the purpose of your coffee infographic and imagine the intended audience, which will make it easy to select the required content, appropriate lexis, and suitable visuals. Also, you should consider whether the audience is novice or expert in the sphere of coffee.
Next, what makes a good infographic is pertinent, proven, and interesting content. So, the next step will be the collection of relevant data, which can be supported by credible sources. You may add some interesting facts in numbers to your coffee graphics. Importantly, structure your information in a comprehensive way. The data should be represented consequently and coherently.
Then, you can simply use some of the templates like this one and insert your data in them.
Besides that, there are plenty of tools in which you can design coffee graphics, such as Canva, Picktochart, Freepik, Infogran, Google Charts, Venngage, and others.
When searching for infographic sources, you may find out that there are several basic types of templates such as flowchart, timeline, side-by-side comparison, and data-driven graphics. A flowchart infographic is best for the depiction of some consequent flow of processes or facts. A timeline infographic will be suitable for describing some chronology of events, products, for instance, if you prepare information on everything about coffee history. Side-by-side comparison design helps to show the benefits of one type of concept over another and will suit perfectly for analyzing different types of coffee drinks. Data-driven infographics usually contain a large number of statistics and data which is good for competent viewers. There is also an image-heavy type of infographic, which has a number of visual content, shapes, designs, and photos rather than figures and numbers.
Further, if you don't use the platform for creating a coffee drink infographic, download your template to PowerPoint. Additionally, you may want to include your logo or link to your website. Now, you can publish or print your work.
What makes a good infographic?
To design an appealing visual representation of your data and make information about coffee explained well, it needs to address several points.
- It needs to tell a good story about the subject matter. For instance, if you are going to display everything coffee makers need to know, provide a coherent narrative on the topic. It should have an introduction, body, and conclusion.
- Bring some new angle to the topic. For instance, when designing a coffee infographic poster, use some creative ways to represent the data in coffee charts.
- Your coffee drink infographic should bring some value to the audience. Therefore, when making it, ask yourself the question of whether you inform your viewers and bring some useful information.
- Check if the coffee infographic conveys one general idea and whether it has the key message.
- What is more, include only verified information and add credible sources which will make your work more reliable.
It may also be interesting and useful to look through the infographic on infographics that will give a new angle on how to prepare an effective coffee infographic. For example, view the following infographic of infographics on Visual.ly.
Don’ts of infographic design
As well as there are dos, there are also don'ts for coffee infographic design.
- Don't confuse the data. It means that the message from your chart or graph should be easily comprehensible. The audience shouldn't get confused about what you have meant by displaying unclear facts or charts that only you can understand.
- Don't use charts or graphs that are too complex. Puzzles and excessive data will not please the audience. Instead of being engaged in these puzzle games, they will easily get frustrated. Try to use simple types of coffee drinks chart, be clear, and use colors smartly.
- Don't overuse text. Remember that an infographic is a visual data depiction, and you should only include enough text to support your visuals.
- Don't overuse colors. A brightly colored coffee drink chart or one where colors don't look good together will make your infographic lose appeal. If you use several colors, combine them with an artistic taste. For instance, the infographic template Rocket Infographic Elements has several colors, but they all look great together. What is more, infographic colors usually show data density. Thus, the light colors will reflect the lower number, while the dark colors will represent the larger number.
- Don't overuse icons and stock images. To remain visually appealing, it doesn't need to have too many photos. Creating minimal infographics will only benefit your style.
- Lastly, don't forget to proofread. Not only do you need to check the data provided, but also edit and proofread all texts, names, titles, etc. Every work containing at least some text requires a grammar check.
Coffee infographic templates inspiration
There are a lot of stock infographic samples on the web. Some of them look very inspiring and can give you some insight into your own coffee infographic or just provide you with some useful and interesting information about coffee. You may find a number of templates on Freepik or view the sample showing the history of coffee on Venngage or the template on Pinterest. A great number of guides about different coffee types, history of coffee, the ways of making coffee, etc. are located on Finedininglovers.
Final word
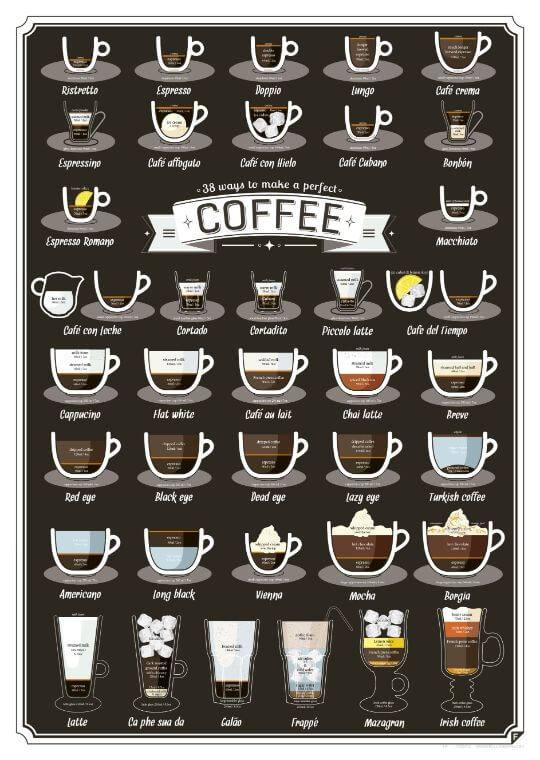
I hope this “coffee article” brought you insights on how to prepare a good coffee infographic or provided you with some new information about drinking coffee. There's an interesting fact that everyone who loves coffee has their own favorite type of coffee, whether it is a latte, cappuccino, espresso, americano, orange coffee, frappe, or something else. Almost all coffee lovers have their precious special coffee drink, while only a minority few who like experimenting with the drink and always try new tastes. Probably, this can also be a great theme for coffee infographics. What is your favorite cup of coffee?
Read Also
Do You Know When to Use Infographics?
Some Staggering WordPress Facts [Infographics]

Writer and editor with 4 years experience in research writing and 5 years in professional editing. The areas of interest include psychology, online marketing, web design, game design, art, innovation, and scriptwriting. Reach her on Facebook.
Get more to your email
Subscribe to our newsletter and access exclusive content and offers available only to MonsterPost subscribers.

Leave a Reply
You must be logged in to post a comment.