Infographics are the Perfect Tool for Enhancing Any Text
- Purpose of Using Infographics
- Infographic Sizes
- Standard Infographic Dimensions
- Advice for Using Infographics
A well-known English aphorism says “a picture is worth a thousand words.” By following this saying a lot of people from education to the marketing sphere use infographics to systematize information and make people feel interested in the given material. Besides, infographics are not only about a specific sphere but also about the everyday environment: traffic signs, subway maps, tag clouds, musical scores and weather charts are just a few examples.
Speaking about numbers, information that is presented in the form of graphics is thirty times more likely to be read than boring text articles. Moreover, 40% of people perceive better visual data, than just black letters on the white background. One more interesting fact is that 90% of the materials transferred to the brain are visual. It is an interesting fact that creative infographics are often the most effective, as they can be securely attached in the mind of the observer for a long period.

An infographic picture is a collection of images, various charts (column, pie, line, spider charts, etc.), tables and minimal text that presents a topic in a way that is easy to understand. So this article will be devoted to infographics. To make the information comprehensive we suggest a brief plan:
- Purpose of using infographics;
- Infographic sizes;
- Standard infographic dimensions;
- Advice for using infographics.
Purpose of Using Infographics
Before creating an infographic, it is vital to find out where you can use it. Here are some basic ways of using an infographic.
- To make a resume attractive, by emphasizing strengths, and showing creativity and critical thinking.
- To organize and present investigation data. Numbers are better in the graphical form, for the audience to understand the significance of it and see the real result of the research.
- To make complicated data simple. For instance, in the educational field teachers use charts and tables to summarize data. Students rather look at an infographic than read a long text with the same content.
- To explain the procedure of work, as with the help of infographics, skilled designers put apart complex products like cameras or clocks, and graphically explain their features, mechanism inside and, of course, the working process.
- To compare things, because while comparing two or more objects, infographics help with finding similarities and differences in various criteria, so that the audience is not confused.
- To simplify the writer’s work, since it can easily be printed out as handouts in the form of posters, brochures, and leaflets when necessary as handouts.
Infographic Sizes
Infographics size is the most important thing in creating, as size can spoil you the whole image even if it is done in the best possible way. Moreover, there is a specific size for tablets and smartphones, for public networks and blogs.
Generally, an ideal infographic width must not exceed 600 pixels and the length should not be more than 1800 pixels. This will suit most websites and blogs.
Sizes of infographics for devices
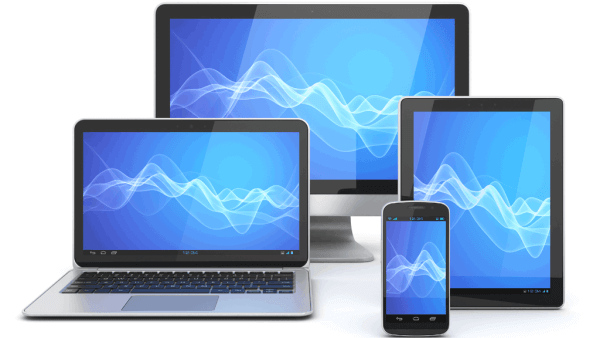
As we live in an extremely high tempo of life, tablets and smartphones are convenient to use for various purposes, such as surfing the Internet, interacting with friends, sharing pictures, etc., rather than a laptop, which is used now mostly just for studying and work.
In general, you should create infographics that tablet owners can clearly see and get the information. So the graphic needs to be between 600-640 pixels. To do everything the right way, it is suggested that you write down all the specific dimensions recurred by different websites. In other words, all infographics downloaded from infographics submission platforms suit tablet screens perfectly.
Nowadays, is not possible to leave a cellular phone for a single second and without one we even cannot imagine our life. Undoubtedly, they differ from the previously described device by size. They are much smaller than tablets. A digital phone, in general, has a 4-inch or larger display area. So check whether your infographics is 288 pixels in width and no larger.
Infographic sizes for online platforms
Platforms in which it is possible to upload infographic pictures support various dimensions. That is why it is essential to consider proportions which are accepted by the platform. So it is better for you to study beforehand the platform rules about the size of the pictures and which size can be uploaded.
Well-known social network Facebook users are allowed to communicate, share news, and upload different information in 37 various languages on this website. Therefore, there is a high possibility that this platform will increase your shares, and as a result, rise people’s recognition of your works.
Facebook allows you to post an infographic with the smallest size of 403 x 403 pixels and with the biggest size of 2048 x 2048 pixels. So you have a bit of flexibility with the platform in comparison to other sites. For the shared post image, the infographic size should be 1200 x 628 pixels.
From 497 x 373 up to 2048 x 2048 pixels infographics are allowed at Google Plus.
If it is difficult for you to understand why they have such requirements, it is better for you to check out the Google+ platform. It’s good to share your infographic with Google Plus since it is owned by Google and will automatically increase your ranking.
The standard infographic size for blog posts is 663 x 2000 pixels. You should test what works best for your blog post-placement. Please do not forget that your readers will check out your infographic from various screens sizes.
In Twitter, a single image or GIF has a 1200 x 675 pixels infographic size. If you’re posting the infographic as a part of multiple images — 1200 x 675 pixels.
On Instagram, an infographic as a square should have a size of 1080 x 1080 pixels. In the case of Instagram Stories, only 1080 x 1920 pixels infographic pictures should be used.
Snapchat infographic size is 1080 x 1920 pixels.
Infographic size for printouts.
If you prefer to print your infographic for a poster, flyer or resume, consider these infographic sizes:
- Letter size – 8.5 x 11 inches;
- Legal size – 8.5 x 14 inches;
- Executive – 7 x 10 inches;
- Tabloid – 11 x 17 inches;
- Photo – 4 x 6 inches;
- A4 – 8.3 x 11.7 inches;
- A3 – 11.7 x 16.5 inches;
- A horizontal image must have 1080 x 566 pixels size;
- A vertical image should be of 1080 x 1350 pixels size.
Standard Infographic Dimensions
Not only size can influence the quality of the infographics but also other criteria, such as orientation, height, width, and relation.
So, the first point we should discuss is orientation. Before creating a whole infographic illustration, you should think of the orientation of the paper for pictures to look appropriate and not only be just decorations but also accomplish the text itself. To do this doing you need to check the infographic sizes presented above.
There are two basic orientations: portrait and vertical. According to statistics, 81% of the top reviewed creations are vertical, as opposed to horizontal orientation or square. Horizontal orientation is better only for tablet apps.
There should not be any disagreement in saying that the image, for a better perception of the picture, has to be proportional. The correlation between width and height for vertical infographics is 1:4 respectively. Let’s think of how will it look like in real life: with a general width of 600-1100 pixels, that should take you about two or three scrolls to finish reading. For horizontal works, the correlation is a bit different 3:2 — much closer to the dimensions of your computer screen.
Advice for Using Infographics
- Do not choose a huge size to share on social media, for people not to be overwhelmed with the information, as they just simply won’t read it.
- There’s no perfect size, but to start it is better for you to choose basic ones—600 pixels wide and 2000 pixels tall. It is better to make it small, to be practical, as tiny images can be viewed even from mobile screens.
- Use colors wisely. It is important to study the psychological aspect of colors to make highlights pleasant for the eyes. So do not use too many bright colors and do not make it colorless to find the balance for people to enjoy the view.
- Try to use images that suit together. For example, choose pictures of the same theme, or background color, or style, as the outlook of completely different images, which do not have any same features can seem to be unnecessary.
- Study the audience who will look at your infographics. Some people like images more than the text, others need a detailed explanation. Also, people can be sensitive to the colors as the associations with the color might be completely different. Besides, people can use different devices to familiarize themselves with your works.
Please consider all the advice to improve your infographics.
Read Also
Get High Quality Backlinks Using Infographics
Do You Know When to Use Infographics?

Get more to your email
Subscribe to our newsletter and access exclusive content and offers available only to MonsterPost subscribers.

Leave a Reply
You must be logged in to post a comment.