How to Measure Your Social Media Marketing Performance on Instagram? 4 Valuable Metrics to Consider
Social media promotion on Instagram is no longer a trend but a necessity. Instagram is an incredibly popular platform, and each time it launches a new feature for businesses, it seems to gain momentum. Instagram strives to improve the user experience and motivate owners of business accounts to invest time and money in their promotion.
But speaking of social media marketing campaigns, investing resources will not be enough. You should know which content is more useful for your promotion strategy and which one is not.
How to identify weaknesses and maximize strengths? The key is to analyze the Instagram account activity and make the right decisions based on the results.
This time, I am about to tell you how to track statistics and monitor the profile growth on Instagram using four valuable metrics.
1. Count Conversions
Look at the image below.
All people who had an intention to visit your Instagram profile or a site are called warm leads. Your goal is to turn warm leads into hot leads - those who are ready to make a purchase.
Also, if you are trying to expand your sales volume through Instagram, you need to engage more potential customers, including cold leads (users that saw your profile but didn’t follow one). You decide upon which of the marketing strategies to use, whether it’s posting more of the sales content, increasing the number of followers, creating a viral content or launching a competition.
You may wonder how it can be related to conversions. The answer is, if you build the same sales funnel, it will give you a hint which of the strategies will work best for your profile.
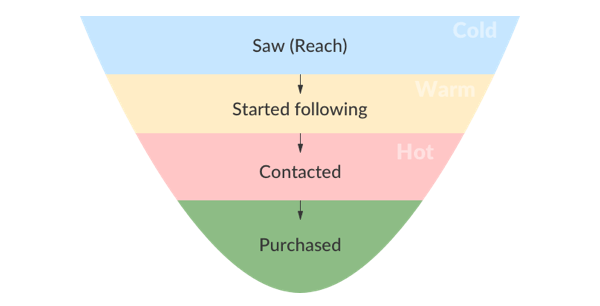
Now, let’s do a little of math (at least somewhere your school math knowledge will be handy). Go to Google Sheets or MS Excel and create a performance table with these four sales funnel stages - Saw (Reach), Started Following, Contacted, Purchased.
Use Instagram Insights to calculate the number of users who contacted you in the Direct Messages as well as the number of valuable comments on your posts.
How to calculate Conversions?
Begin with the “Started following” row. Divide the number of new followers by the number of all profile viewers (Reach). To count the number of direct contacts, divide the new contacts by the new followers. Finally, divide the number of purchases by the number of direct contacts to count down the conversion rate for the “Purchased”.
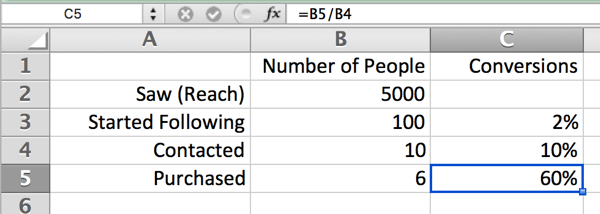
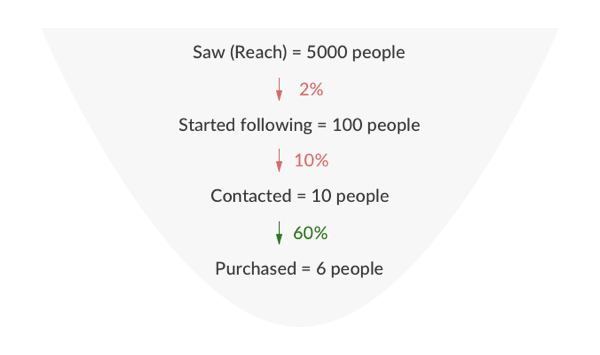
This sales funnel is the best way to visualize the user's path from a cold lead to the purchasing stage. The table allows you to see your weaknesses and stages you should work on more for a better sales growth.
This is how a sales funnel will look like in the end:
2. Define the Followers Growth Level
The total number of your followers is always displayed on your profile page. But do these numbers represent your profile growth and the community progress?
With the existence of mass-following and software to help you gain thousands of followers within one day, their total number hardly means anything Instagram. What matters is knowing the number of newcomers who follow your profile within a specified period.
If you want to track your new followers easier, use Google Sheets again.
First, add the row in your spreadsheet to show the number of all Instagram followers by month.

Now you need to calculate the monthly followers’ growth.
Add another row to show the number of new followers. To calculate one, take the current number of followers and subtract the number of followers from the previous month. Now you are aware of the monthly sales growth situation on your Instagram profile.
Next, add a Growth rate row to calculate its value by taking the number of new followers of the current month and dividing them by the number of followers from the previous month. Multiply by 100%.
Got it? If not, here is that the visually-represented formula.

If the number of new followers remains steady every month, this does not mean that your community experiences the steady growth. The example below proves it. The numbers stayed roughly equal every month, but in general, the growth rate is declining.

The growth rate shows how fast your Instagram community expands from month to month and determines which months were the most productive, and which ones were, on the contrary, least successful. When you know your growth rate numbers, you can set the key performance indicators and even predict how many people are going to follow you in the upcoming months.
3. Count the Engagement Rate
The engagement rate measures the involvement level of your Instagram published content coming from the audience’s activity.
The Engagement Rate can be of several types:
- engagement rate by reach or ERR Reach;
- daily engagement rate or ER Day;
- engagement rate of post or ER Post.
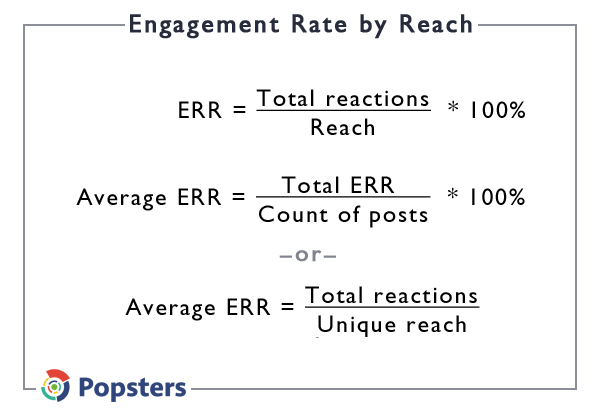
How to count each? This is how the basic formula for each ER looks like:
1. Engagement Rate by Reach
Source
The first and the prime formula shows the percentage of users and their activity of the particular post. The average ERR shows the average percentage of users who saw the profile posts and showed some activity.
2. Daily Engagement Rate
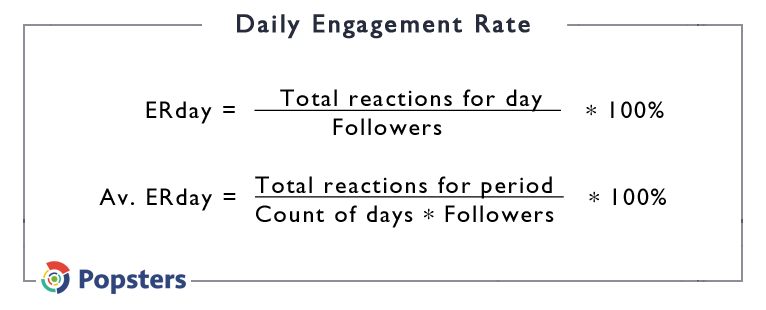
Source
The final value shows the approximate number of daily active users out of the entire number of followers.
The results are only presumptive since the formula does not consider other ER indicators or the fact that some active followers could make the same actions several times etc. Have that in mind!
3. Engagement Rate by Post
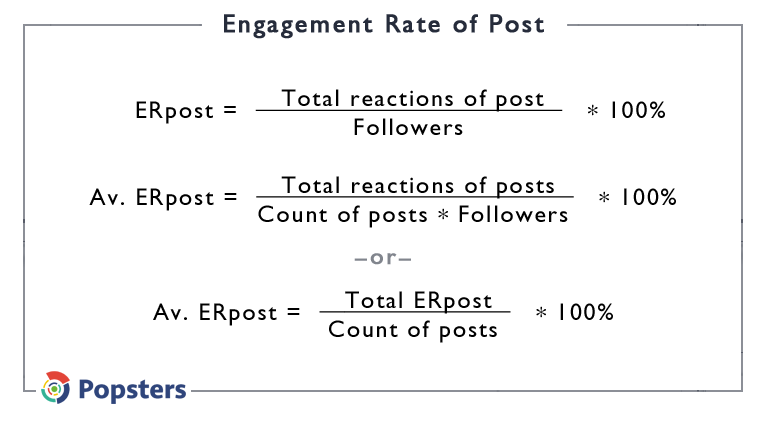
Source
The final value demonstrates the average percentage of users involved in a particular post.
Unlike the ERR, this indicator is based on the absolute value in the denominator (the number of subscribers) and will not substantially differ from one post to another.
Important Reminder...
Remember that you can use the free analytics tools for Instagram to track your engagement rates by likes or comments.
In particular, Simply Measured allows you to track comments and other indicators of your business Instagram account. The Simply Measured Engagement diagram shows how liking and commenting have changed over time.
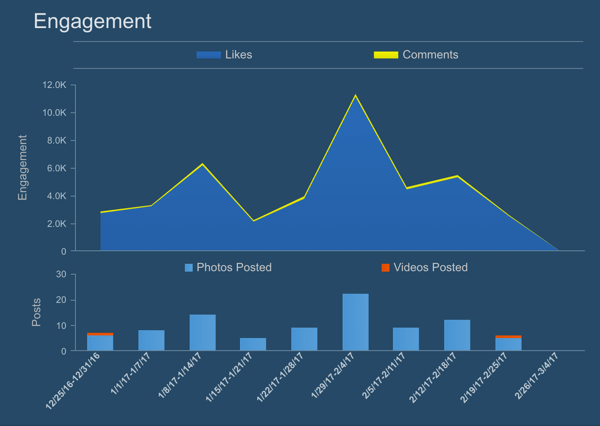
Here you can also find out the average number of comments per 1 post and even analyze what users write in their comments! Such data can be valuable, so make sure you add the statistics from Simply Measured to your performance sheet.
Hashtags and Their Analytics
Do not underestimate the value of hashtags! After Instagram recently allowed users to follow specific hashtags, assessing ones will help you increase your Instagram profile visibility.
The formula is clear:
Correct hashtags = new followers
In the past, it was useful to add all the most popular hashtags to your post. What about now? Forget about it. A large number of hashtags no longer helps marketers get to the top. So, if you do want to include hashtags, choose ones that support your subject.
I recommend adding about 3 to 5 hashtags for one post. Also, a good idea would be creating your own personal and easily-recognizable hashtags.
To track their effectiveness and the number of followers “brought" to your profile by clicking those hashtags, visit the known Instagram Insights.
End of the Line...
Measuring your social media marketing performance doesn’t sound as fun as choosing the right filter for your next photo on Instagram. It requires a little bit of patience, some high school math skills (hope you can handle it) and a little time to make this process regular.
I gave you the four most valuable metrics. Use them if you want to increase your sales potential through Instagram. Once you work on your weaknesses and enhance your strengths, I promise that you will see positive results.
No more neglecting - start analyzing your growth rate factors now!

Read Also
Master the Hashtag Game! Top Tools to Track Instagram Hashtags Performance
H6 Free Analytics Tools For Instagram Business Accounts
Step-by-Step Guide on How to Setup and Manage Instagram Ads
How to Implement Rich Social Snippets for Social Media (Facebook, Twitter, Google+, Pinterest)…
Get more to your email
Subscribe to our newsletter and access exclusive content and offers available only to MonsterPost subscribers.


Leave a Reply
You must be logged in to post a comment.