How to Make a Gantt Chart in PowerPoint: 5 Methods & PPT Templates
- What is a Gantt Chart?
- How to Create a Gantt Chart in PowerPoint
- Useful Tips
- Collection of Free Gantt Chart Template for PowerPoint
- Choose Some of Our Premium PPT Templates for the Showcase
- Summing up
Gantt Chart template Powerpoint. Do you need to create a Gantt chart? There are many options. In this article, I’ll show you how to create a Gantt chart presentation and provide you with a set of quality ready-made Gantt chart templates for PowerPoint. Choose the best method for you.
What is a Gantt Chart?
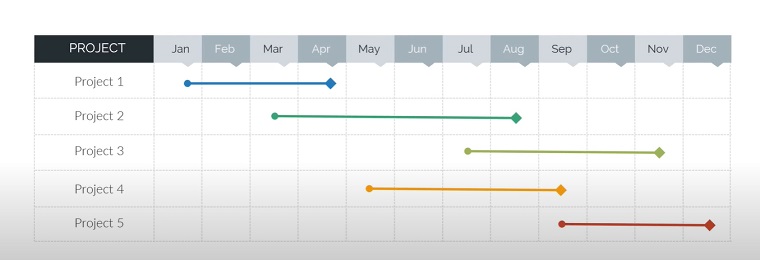
A Gantt chart is a popular type of bar chart that is used to illustrate a plan or a schedule for a project. In the picture, we see a Gantt chart for project planning. Each segment can correspond to a separate project, task, or subtask.
You can visualize the total time spent by the project, the resources involved, as well as the order and dependencies of the tasks.
In a nutshell, Gantt charts are project maps that illustrate what needs to be done, in what order, and at what time.
To display a Gantt chart, it usually requires at least a start date and an end date. For more complex Gantt charts, you must enter a percentage of completion and/or dependence on another task.

How to Create a Gantt Chart in PowerPoint
Surprisingly, the Gantt chart, which is one of the most well-known and used types of charts for management planning, is not represented in PowerPoint. We can create a similar timeline chart but not a Gantt chart, specifically. Microsoft Office does include it in the Microsoft Project program.
You can use a program such as Microsoft Project to create a Gantt chart and then take a screenshot of the chart and paste it into PowerPoint. In some cases, this is a perfectly acceptable option; however, editing the chart information in PowerPoint will be impossible.
In addition, presentations usually require a very small amount of data. Otherwise, there is a risk of overloading the slide with information and it will be difficult for participants in the presentation to perceive it. Accordingly, it is also quite possible to make a Gantt chart in PowerPoint using Excel.
You can change the chart information at any time because it will be a separate media file that you can simply update. But the fastest and most universal way is a ready-to-use PowerPoint template. This is extremely convenient.
I will give you five popular methods to build a Gantt chart from scratch.
Method 1. In PowerPoint
This presentation tool from Microsoft allows you to not only insert ready-made photo diagrams but also create them yourself. This process is quite simple and does not require the user to have any skills to work with tables. I will show you how using Microsoft PowerPoint 2016. Follow these steps:
- Create a new presentation File>Create>Blank Presentation.
- Next, go to the Insert tab and select Chart.
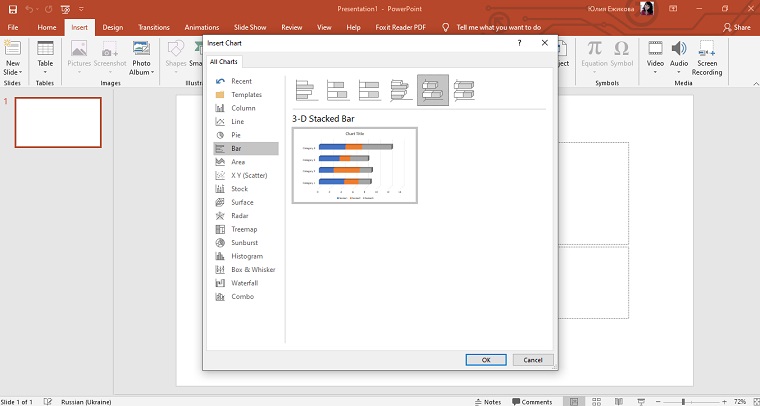
- Click Bar>3-D Stacked Bar.
- A pop-up window will appear, which is an environment for working with Excel tables.
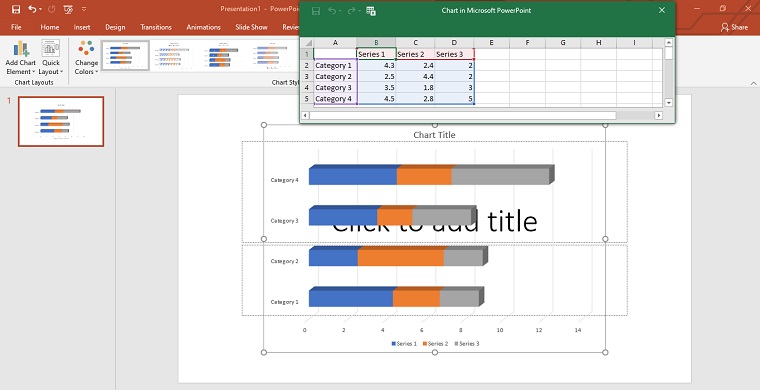
- Enter the necessary information and the result is the following schedule:
- After you enter all necessary data, move the cursor and click on the Chart Filters icon.
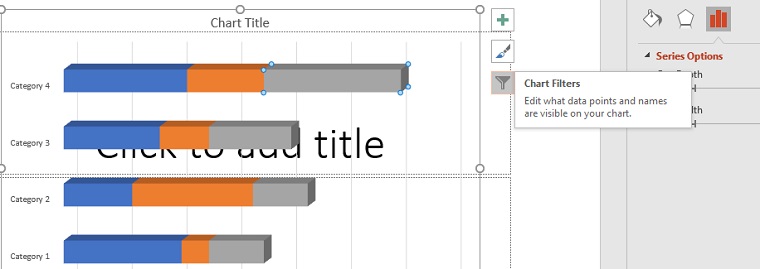
- In the Values block, uncheck all checkboxes except Series 1, click Apply.
Method 2. In Microsoft Project
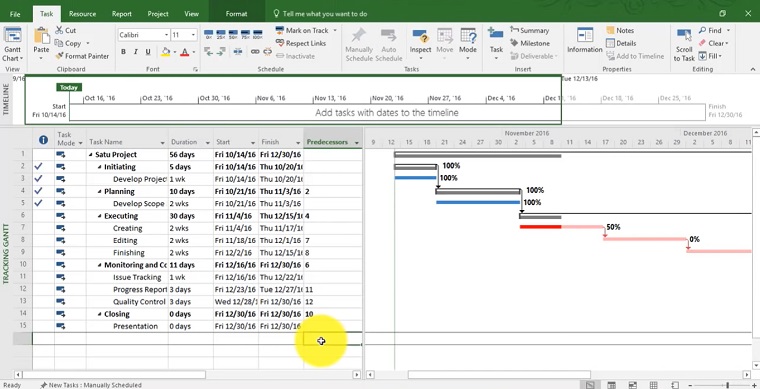
The program was created to manage various projects. Microsoft Project has built-in tools to work with tables, presentations, charts, etc. Microsoft’s familiar tools, such as Excel, PowerPoint, and even Skype for Business, are integrated here. There are additional add-ons. It is important to know that the template is built into this software, so users should not have any difficulties. Follow these steps:
- Go to File.
- Open Options and Customize Ribbon.
- Select a box Project and click New Group.
- In the left column in Ribbon Settings click Commands Not on the Ribbon.
- Scroll through the list and look for the item Gantt Chart Wizard.
- Select the item, click Add.
- Go to the Project tab, where a new block will appear.
- To create a graph, click on the Gantt Chart Wizard button and follow the prompts.
Here is a video tutorial for more details.
Method 3. In Excel
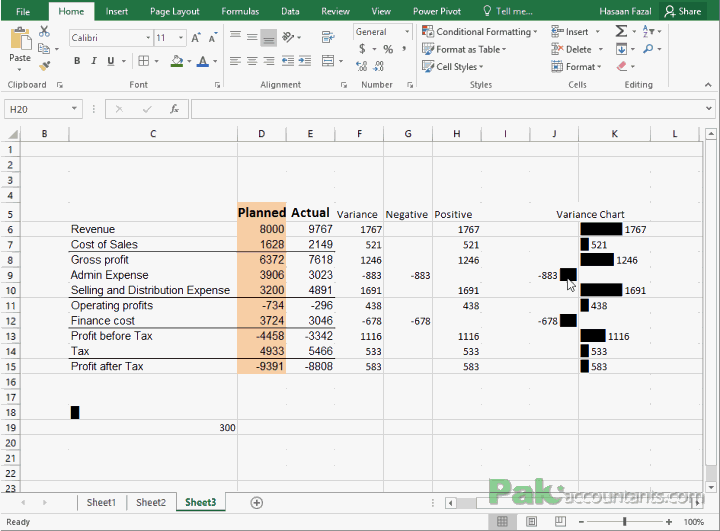
This method involves inserting a Gantt chart from Excel into PowerPoint. The most difficult part is to create the table with information in Excel. I am not a fan of Excel and it may take some people a lot of time. I prefer PowerPoint Gantt chart templates. But, if you have plenty of time, here is a video tutorial on how to create a Gantt chart in Excel.
- In empty columns write the headings: Task, Start Date, End Date, and Duration.
- Select the column Start Date along with the heading and other information.
- Click on the Insert tab, go to the Charts module, and select Bar.
- For better visualization, we will use 3-D Stacked Bar.
- After that, next to the table, a block with a histogram will be displayed.
- Select the resulting chart, go to the “Home” tab and select the “Copy” item.
- Open PowerPoint, select Paste and Keep Source Formatting.
This method is convenient in that it allows you to insert both a table and its chart inextricably.
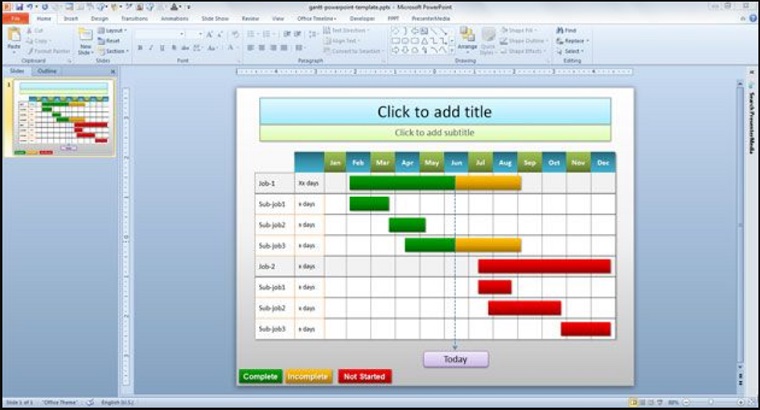
Method 4. Office Timeline add-in
Office Timeline is a PowerPoint add-on that helps you quickly and beautifully draw timelines and Gantt charts. This PowerPoint Gantt chart plugin comes in both free and pro editions. Typically, creating a timeline is one of the most time-consuming processes in presentation design, and Office Timeline will help speed up. According to the developers, their product allows you to create timelines of varying complexity. As for the Gantt chart, they promise that you can handle this within just a couple of minutes. They offer nine timeline templates for PowerPoint at the moment.
The scale created in PowerPoint can be transferred to another office program such as Word.
Method 5. Smartsheet
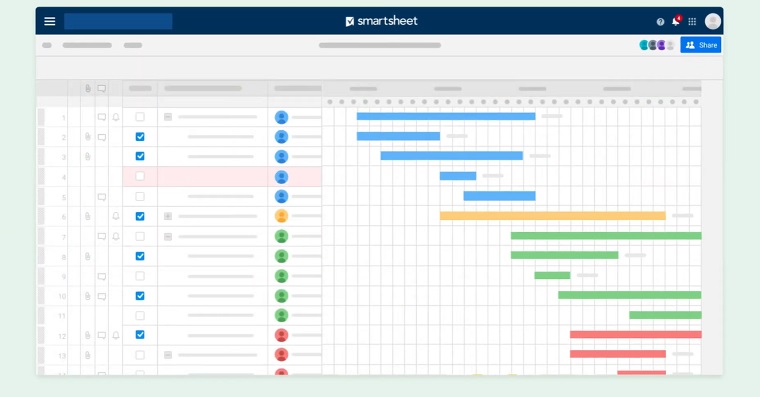
Smartsheet is a premium tool for managing collaboration. You can use project templates and recurring tasks. There is integration with office applications from Microsoft, Google, and others.
It is suitable for large companies with large-scale projects and freelancers who are ready to join other people's projects.
Creating a project is similar to creating a list of tasks in tables. You can import tables from your documents. The Gantt chart is built by clicking on the corresponding icon in the Views section. They also provide video instructions.
Useful Tips
- Color. It’s best to select matching but distinct colors for the chart. The standard requirements for a stylistic image are applicable here. The colors should not be acid-bright shades, or difficult to read. Have a look at some ready Gantt chart templates for PowerPoint for inspiration.
- Animation. I wouldn't recommend applying animation effects to charts. This can distort them both in the process of playing the effect, and at the end of it. In other professional presentations, you can often see various graphs that appear animatedly and demonstrate their performance. Most often these are media files with automatic scrolling created separately in GIF or video format; they are not diagrams as such.
- Weight. Charts also add weight to the presentation. So, if there are regulations or restrictions, it’s best not to make too many timeline charts.
Collection of Free Gantt Chart template Powerpoint
The free Gantt chart template is a better way to communicate your project. Since they were invented, Gantt charts have been complicated, complex, and difficult for non-project audiences to read. So, when your boss wants to receive a great report in a presentation form in a short time, the free Gantt chart template helps you save time. Download a free template, insert it into your PowerPoint presentation, edit the information, and it's ready to go.
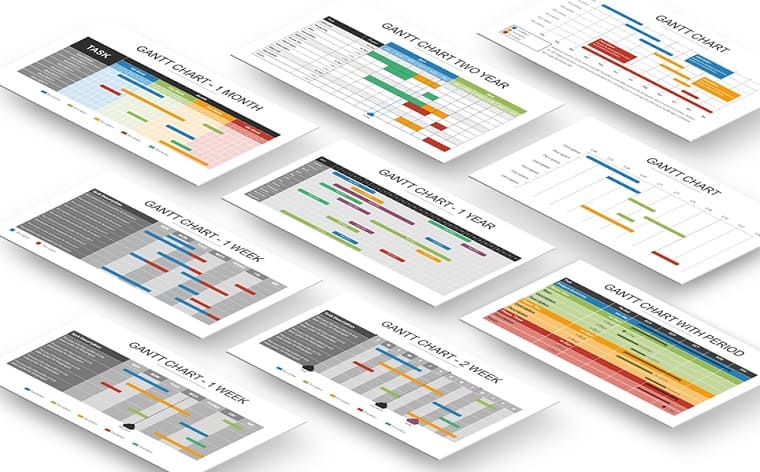
2 Weeks Simple Gantt Chart for PowerPoint

Gantt Chart for PowerPoint and Google Slides

Corporate Gantt Chart

Gantt Chart for PowerPoint

Gantt PowerPoint Template
Choose Some of Our Premium PPT Templates for the Showcase
Free Gantt chart templates are great ideas, but it's not always a quality choice. They are usually created by project management applications for Microsoft Excel. Such templates can be complicated and uninteresting for non-project target groups. They are also difficult to adapt to your style of presentations and cannot be easily edited.
The non-project audience expects an overview of the project and no complicated Gantt diagram. The premium templates allow you to create a Gantt chart in PowerPoint easily. They can be easily presented or included in the project documentation. As I already mentioned, it's a native PowerPoint Gantt chart template. You can edit, share, or reuse the slide for your communications, scorecards, and presentations.
Each of the presented templates has a description and screenshot, as well as demonstration slides.
The demonstration slides show thematic or abstract images with texts, diagrams, and infographics. Thus, I present you with a comprehensive set of visual tools for a holistic and harmonious disclosure of any topic, object, process, and event.
Main features of premium Gantt chart templates below are:
- Universal design
- Huge variety of slides
- Tons of infographics
- Hundreds of icons
- Various themes
- Maps
- Free font used
- Easy to customize
- Color schemes
- 16:9 HD Aspect ratio
- Animations
- Calendars
- Retina-ready
- Fully resizable (vector)
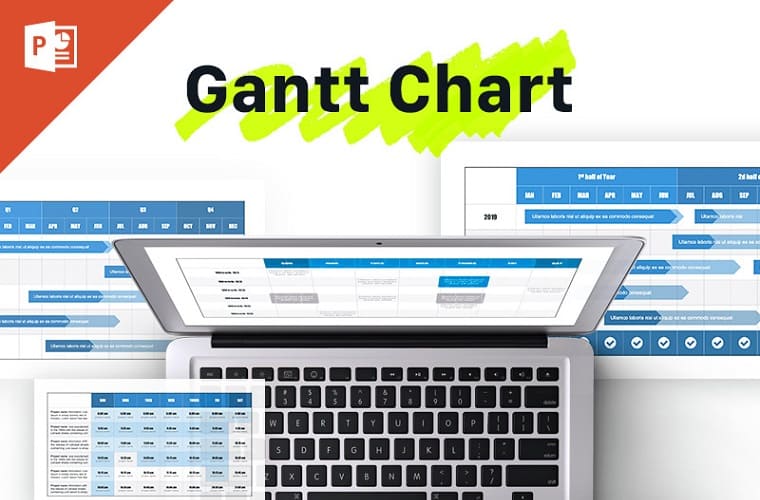
Gantt Charts and Project Calendar PowerPoint Template

Gantt Chart PowerPoint Template
Entorum - Business PowerPoint template with customizable infographics

Business Pack PowerPoint Template

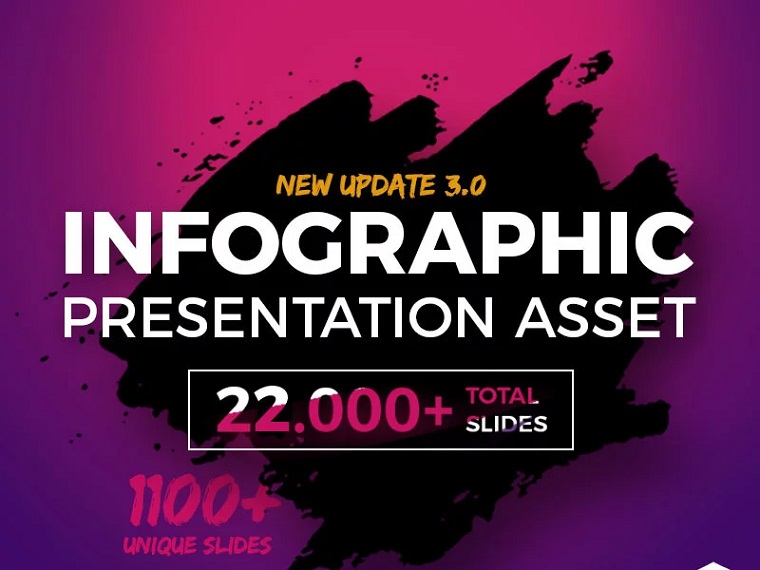
Infographic Pack - Presentation Asset v2.1 PowerPoint Template
Company Report PowerPoint Template

Gantt Chart PowerPoint Template
Multipurpose Business Infographic Presentation - PowerPoint Template

Project Timelines and Roadmaps PowerPoint Template

Business Plan PPT - Multipurpose PowerPoint Template

Summing up
Charts are created to display specific data or indicators. But a purely technical role is assigned to them only in the documentation. In a visual form–in this case, in a presentation–any schedule must also be beautiful and made to standards. It’s important to approach the creative process with the utmost care.
I hope this article was useful to you. Please share it with friends if you liked it.
If you have any questions, ask them in the comments below. Our experts will try to answer as quickly as possible.
FAQ: Gantt Chart template powerpoint
Gantt charts were devised by Karol Adamiecki in 1896. The name comes from its inventor, Henry Gantt, who independently adapted this type of histogram much later in the 1910s.
Gantt charts are useful for presenting scheduling and planning projects. Such timeline charts help you to understand how long a project should take, and plan which tasks you'll complete first. They're also helpful for managing and combining tasks for better time management.
To export the project to a PowerPoint Presentation:
- Open the Export tab > select Microsoft PowerPoint.
- This opens the Export to Microsoft PowerPoint dialog containing options for exporting.
The most important in Gantt Charts PPT templates are:
- Easy to customize
- High-quality design
- User-friendly layout–easy to understand, clear representation of time frames
Read Also
100 Best Business Presentation Templates 2020. Cool! Great! Awesome!
The Magnificent 50 Free PowerPoint Templates

Julia Green is a TemplateMonster author and technology enthusiast in general. She likes to learn and write about web design and e-commerce. She is also interested in psychology, marketing and everything digital. Julia prioritizes the customer experience from start to finish and likes to present information in such a way that the tone and style correspond to the target group. LinkedIn
Get more to your email
Subscribe to our newsletter and access exclusive content and offers available only to MonsterPost subscribers.

Leave a Reply
You must be logged in to post a comment.